Fast Setups with the Setup Wizard
The Setup Wizard provides the fastest way to create a new project with your own data. This tutorial uses data from a location in Vienna, to show you step-by-step how to use the Setup Wizard. Below you can see the result of this tutorial after integrating terrain, land use, and building data into the model. If you need to integrate additional or more complex data into your model, proceed to the Advanced Setups tutorial.

Used Data
The model data used in this tutorial is already located on the server for your selection. If you wish to test data uploads or examine the data in more detail, the most important data is available for download here.
For additional context, the data used for visualization in this tutorial, covering the state of Austria, can be downloaded from the following sources:
1. Create a New Project
Setup Location: Project Menu > New
Follow the steps below to create a new blank project:
-
Open the Application Bar and click on New Blank to create a new project.

-
Choose a name and a directory for the new project to be saved and click on the Create button so that a blank project with three domains is loaded.
.png)
Domain Types
scenarify models use three nested domains, each with a different level of detail:
-
Simulation Domain: The active area where simulations occur. All data within this domain is loaded at the highest resolution.
-
Maximum Simulation Domain: Defines the boundary for the simulation domain. It contains all necessary data for simulation but at a lower resolution. The simulation domain can be placed anywhere within this boundary.
-
Decorative Domain: Surrounds the maximum simulation domain and provides visual context (e.g., terrain or key geospatial features). Simulations do not occur here, and data is loaded at the lowest resolution.
2. Load Terrain Data
Setup Location: Setup Wizard Panel > Coordinate System and Terrain
Before you can load your own terrain files, you need to upload them to make them accessible. How to upload your files is described in Uploading Your Own Data. In this section, we will load a main raster file that defines the terrain data source for the simulation.
-
Specify the terrain data to be used by the simulation with a path to the Main Raster File.

-
In this tutorial, we select the dtm_liesing.tif file, which contains the terrain data of Liesing.

-
After selecting the file, the terrain is loaded inside the three domains with a resolution corresponding to their cell sizes. The file boundary is highlighted in pink.
.png)
Hint:
If you cannot see the boundary of your uploaded file, click on the button next to the file path to focus the view on it.
3. Setup Domains
Setup Location: Action Tool Selector > Domain Setup
The three nested domains can be set up differently, but we recommend the following steps to define their boundaries. For advanced configurations, see the corresponding action descriptions of the Simulation Domain, the Maximum Simulation Domain, and the Decorative Domain.
a) Assign Maximum Simulation Domain to File Bounds
-
Select the Maximum Simulation Domain action in the Action Tool Selector.

-
Click on the border of the main raster file to assign the maximum simulation domain to it.
.png)
-
After applying your changes with the Run button, the terrain data is loaded and displayed inside the selected area.
.png)

Hint: For faster loading, reduce the resolution of the maximum simulation domain by increasing the cell size in the action settings.
b) Place Simulation Domain within Maximum Simulation Domain
-
Select the Simulation Domain action in the Action Tool Selector.

-
Place the domain within the maximum simulation domain by clicking on the terrain. Use the handles to adjust the position and size of the domain.
.png)
-
Reduce the cell size to 2 meters in the action settings to get a higher resolution in the simulation area. After applying the changes with the Run button, the terrain inside the simulation domain is displayed in more detail.
.png)
c) Place Decorative Domain within Decoration Raster File
The decorative domain defines a larger area where data can be loaded with a coarse resolution to provide a visual context around the maximum simulation domain. For this purpose, an optional decoration raster file can be loaded to provide terrain data in areas where the main terrain is not available.
-
An additional terrain can be provided with a path to the Decoration Raster File.

-
In this tutorial, we select the dhm_lamb_10m.tif file, which contains terrain data of Austria with a resolution of 10 meters.

-
After selecting the file, you will see its file boundary highlighted in red.
.png)
-
Switch to the edit mode with the Edit button and use the handles to make the decorative domain cover a larger area than the maximum simulation domain.
.png)
-
After applying the changes with the Run button, the selected area is filled with a context terrain where no main terrain raster was present.
.png)
4. Load Land Use Data
Setup Location: Setup Wizard Panel > Landuse
In scenarify, data about land use help to derive model parameters like terrain roughness and infiltration coefficients, while also providing visual context in the 3D scene.
-
To load land use data, specify the data source with a path to the Shape File.

-
In this tutorial, we select the landuse.shp file, which contains the land use data of Liesing.

-
You will get a warning, that you have to specify the attribute that defines the shape type in the data. Select the attribute NUTZ_ART.

-
Select the preset BEV Landuse to get the correct mapping and coloring of the data.

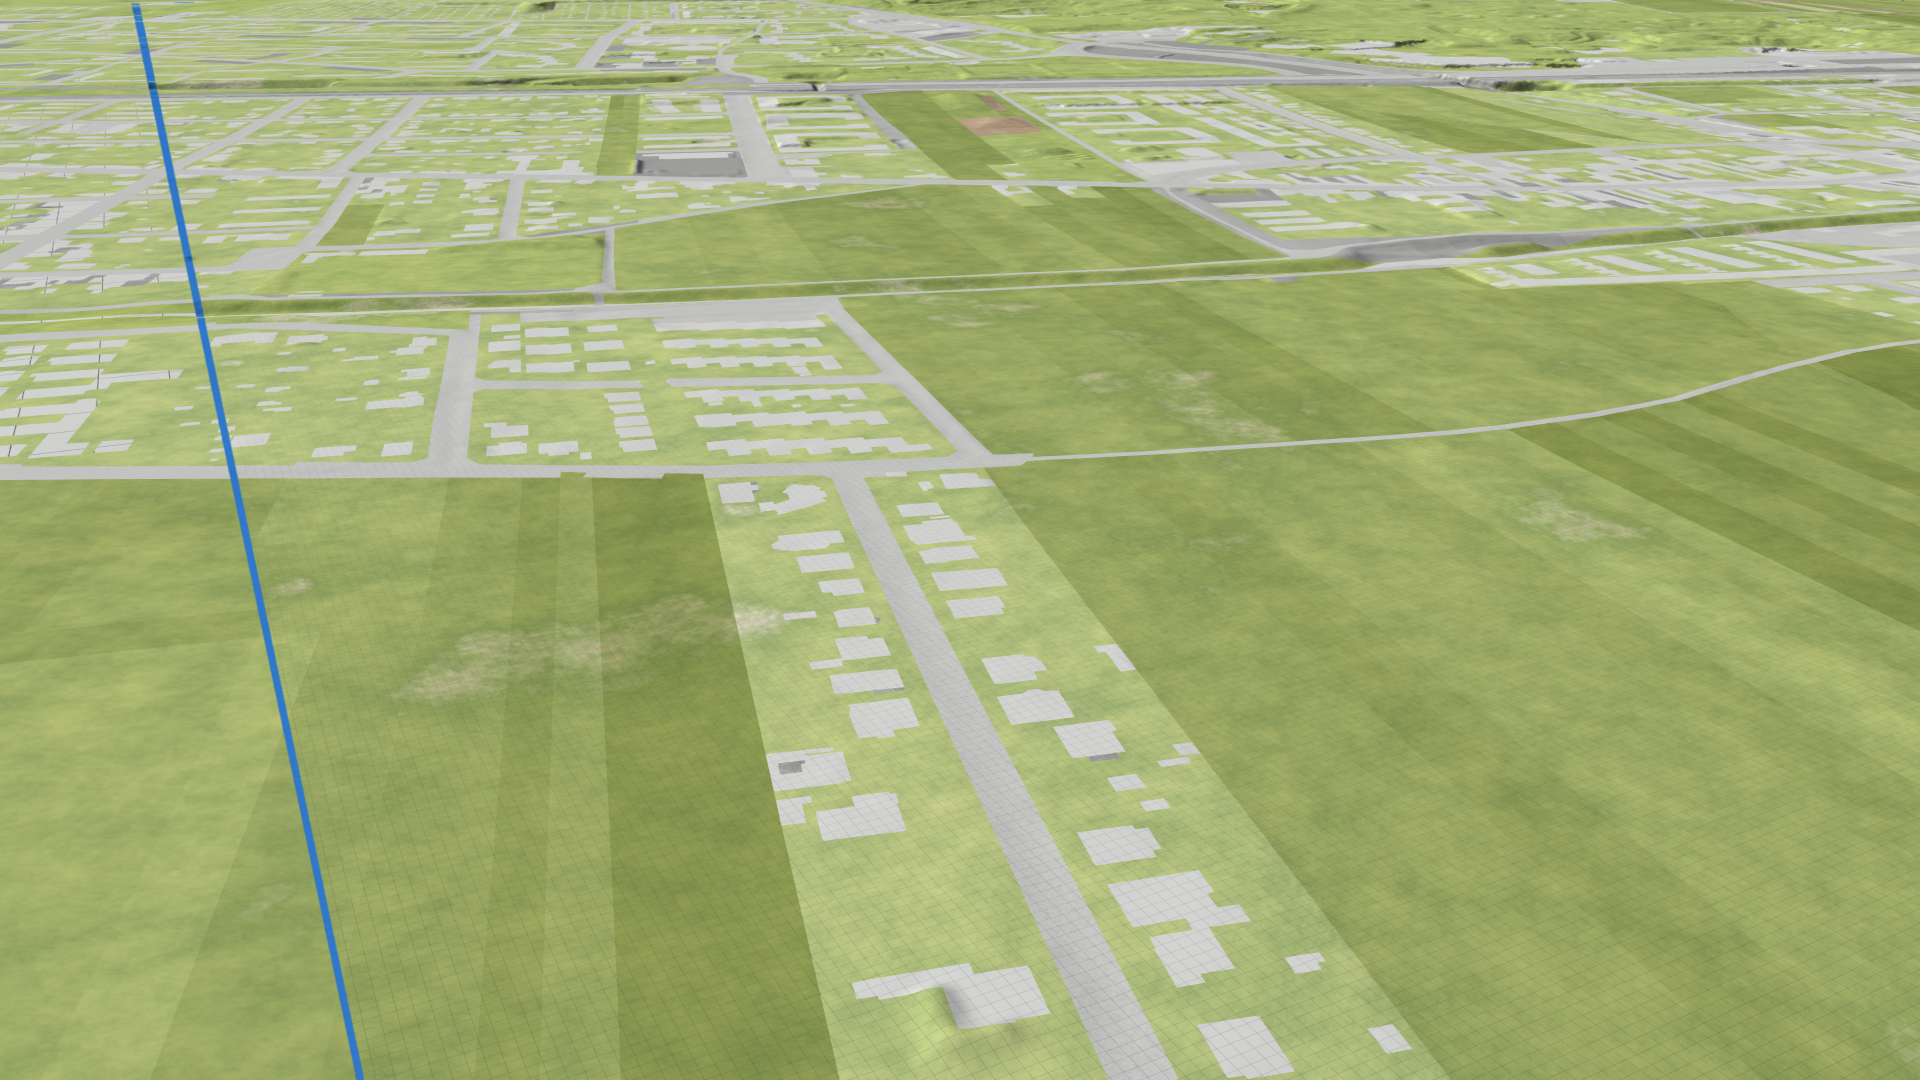
-
The result should look like this, with land use polygons displayed in different colors and the file boundary highlighted in pink.
.png)
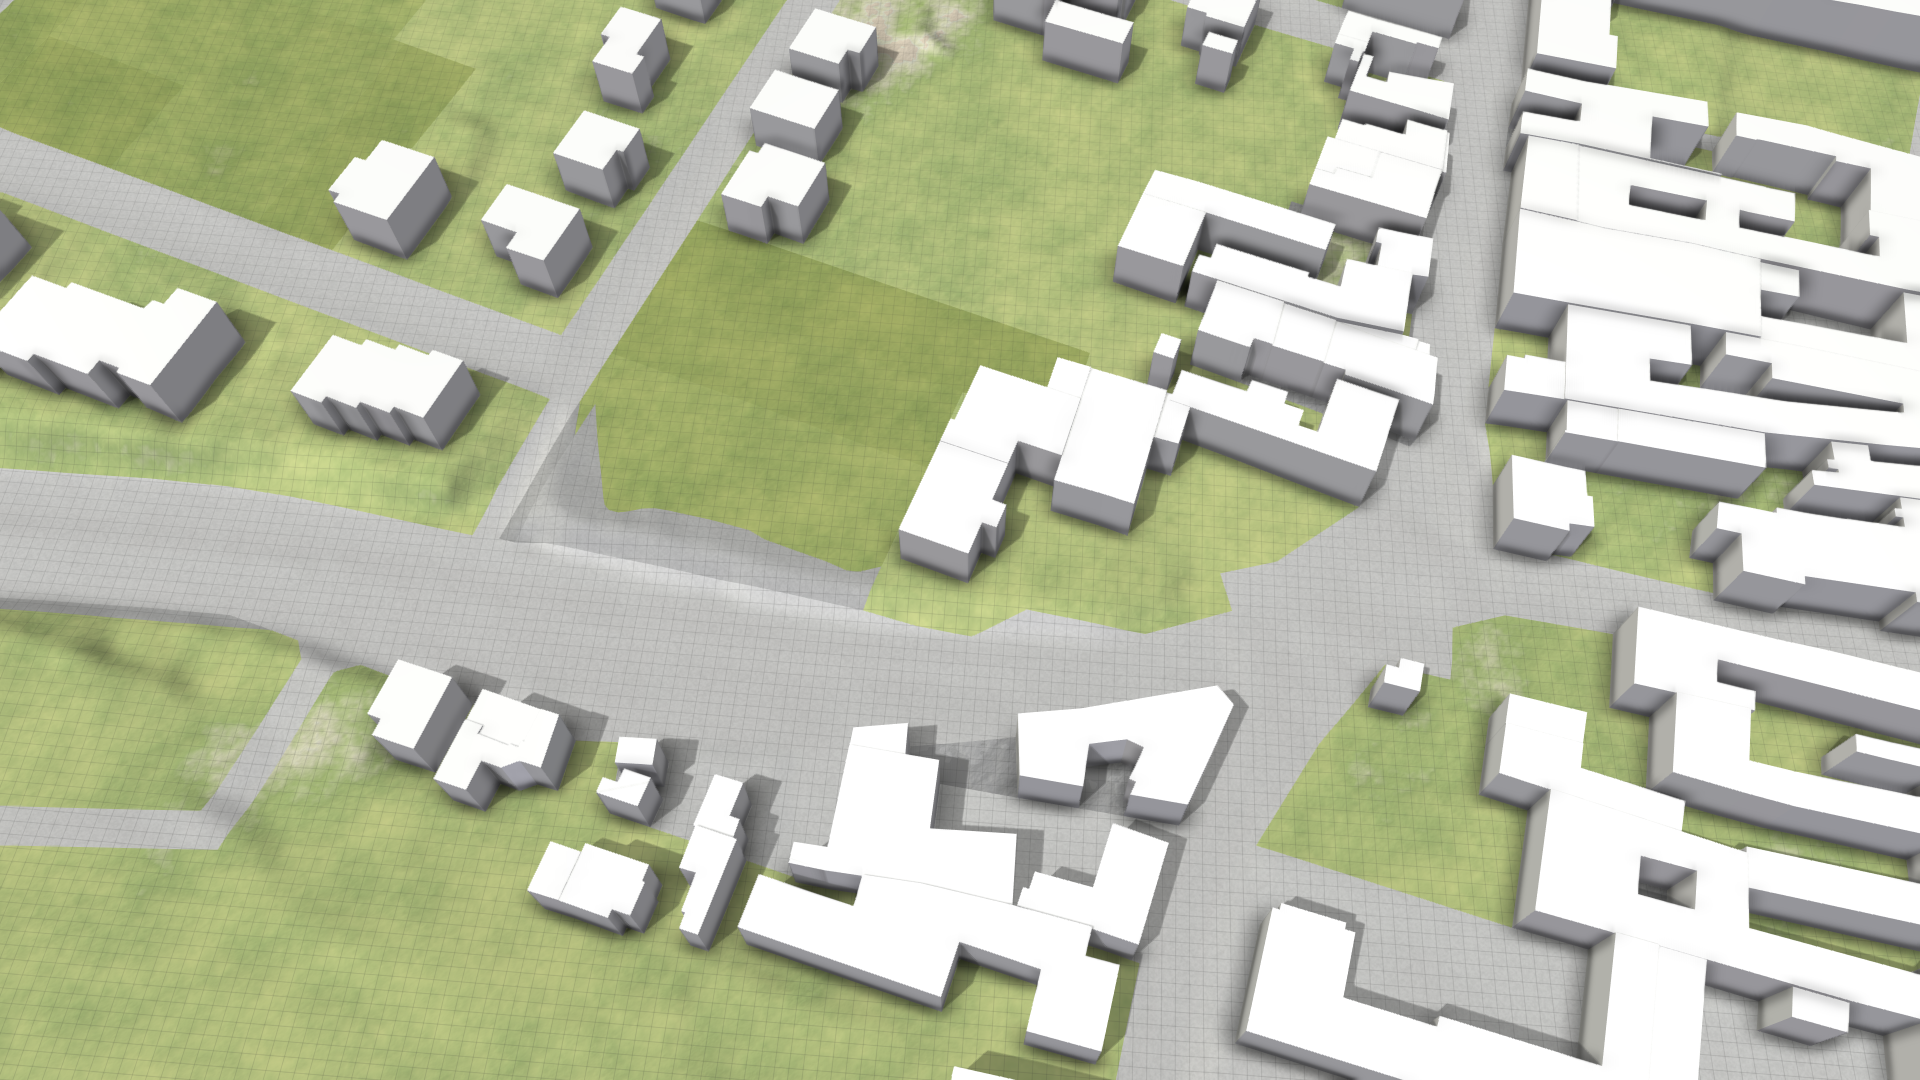
5. Load Building Data
Setup Location: Setup Wizard Panel > Buildings
Buildings play a crucial role in river flood and stormwater simulations. They act as physical barriers for water flow, intercept rain, and provide visual context.
-
Add a new element to the building list.

-
Select Gebäude in the drop-down menu that lists all shape types from the land use data we loaded previously.

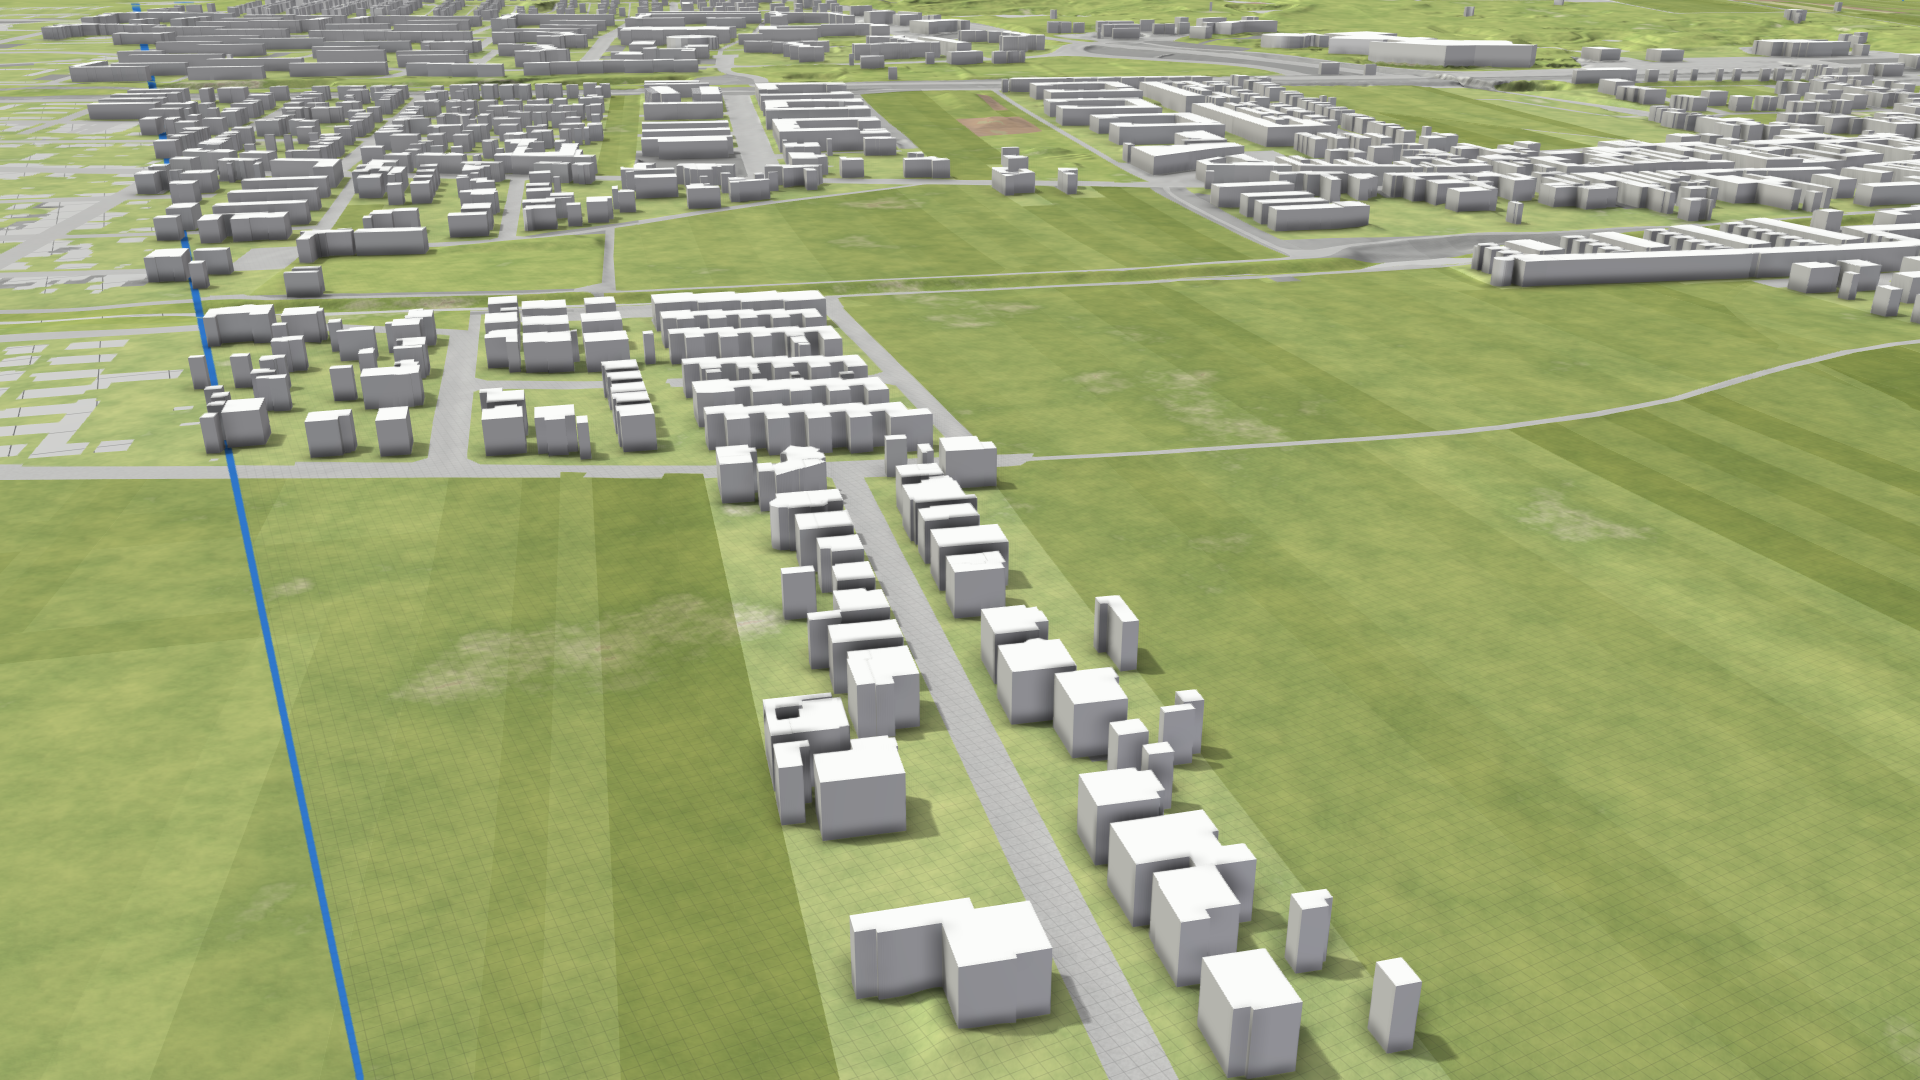
-
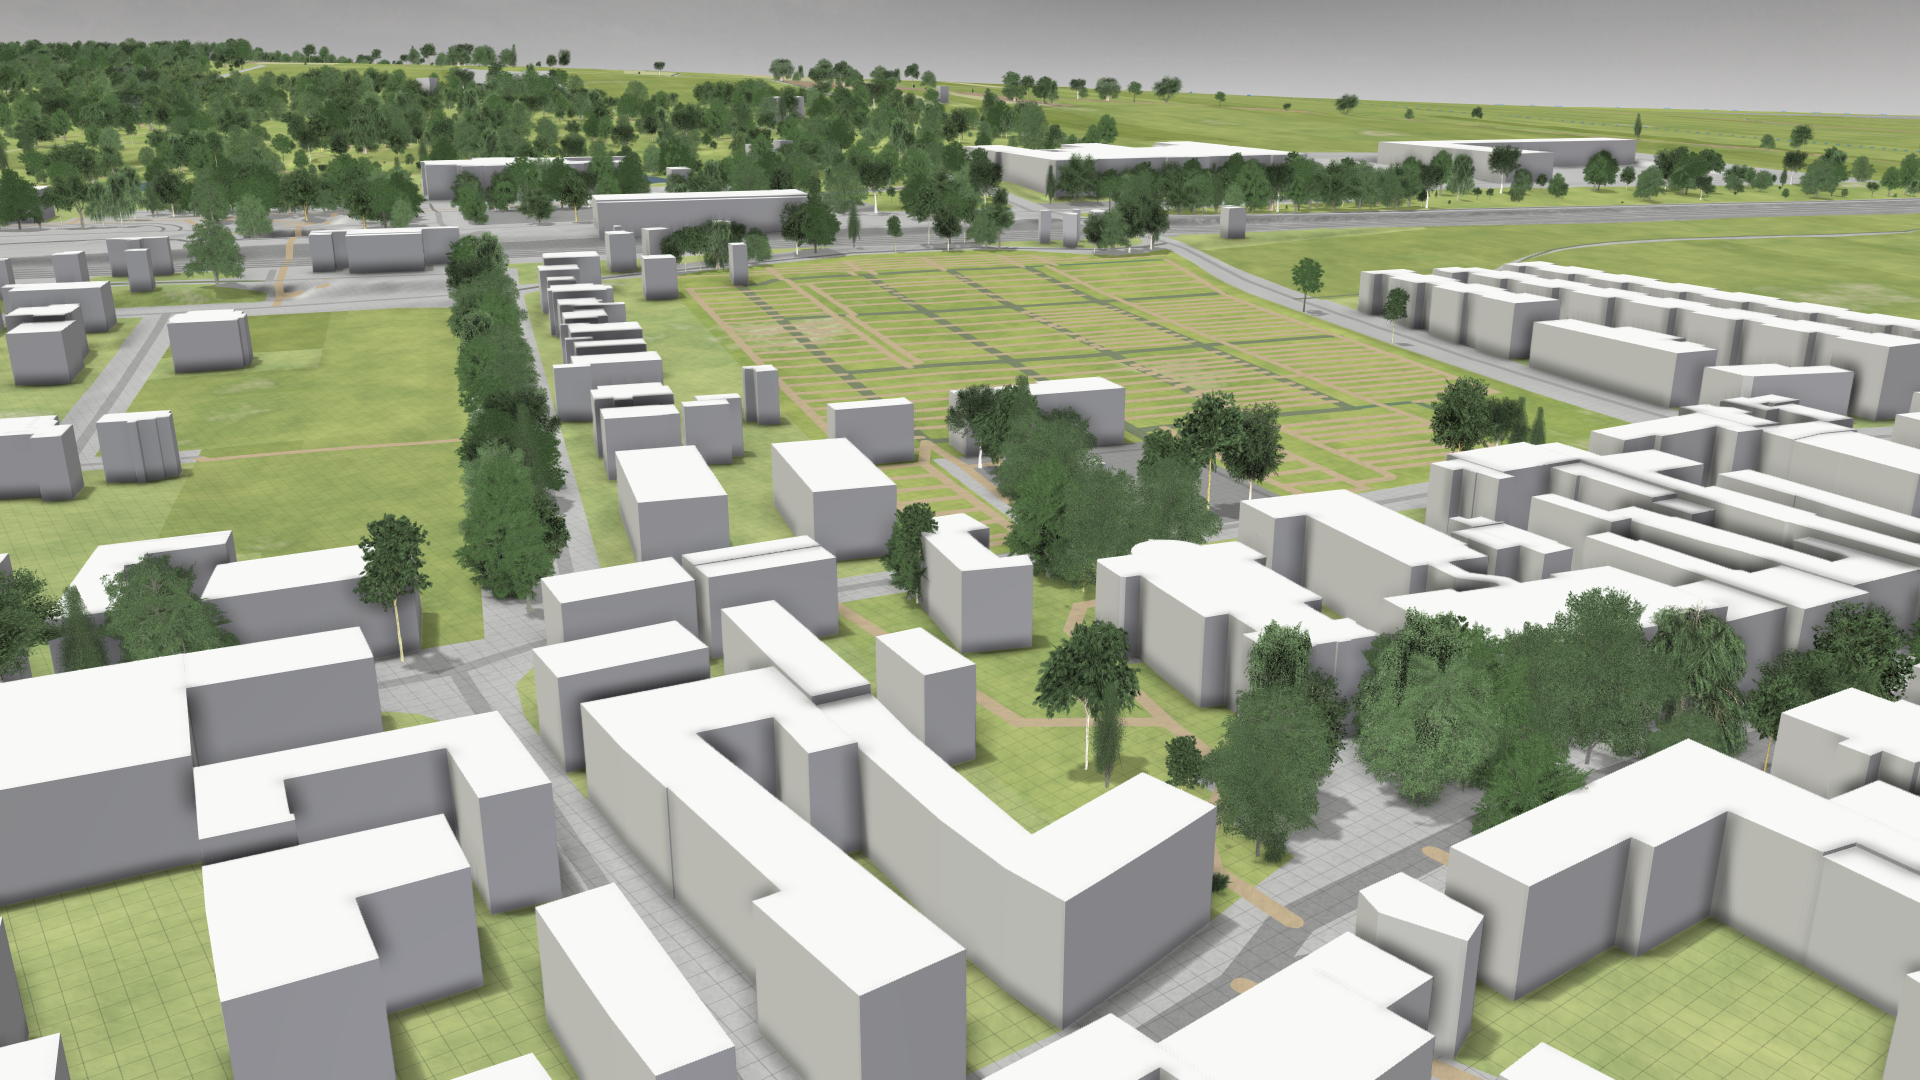
Buildings are now loaded as box models inside the simulation domain.
6. Setup Visual Context
Setup Location: Setup Wizard Panel > Visual Context
In this step of the tutorial, we add additional visual context by visualizing vegetation, water bodies, and transport infrastructure to support orientation.
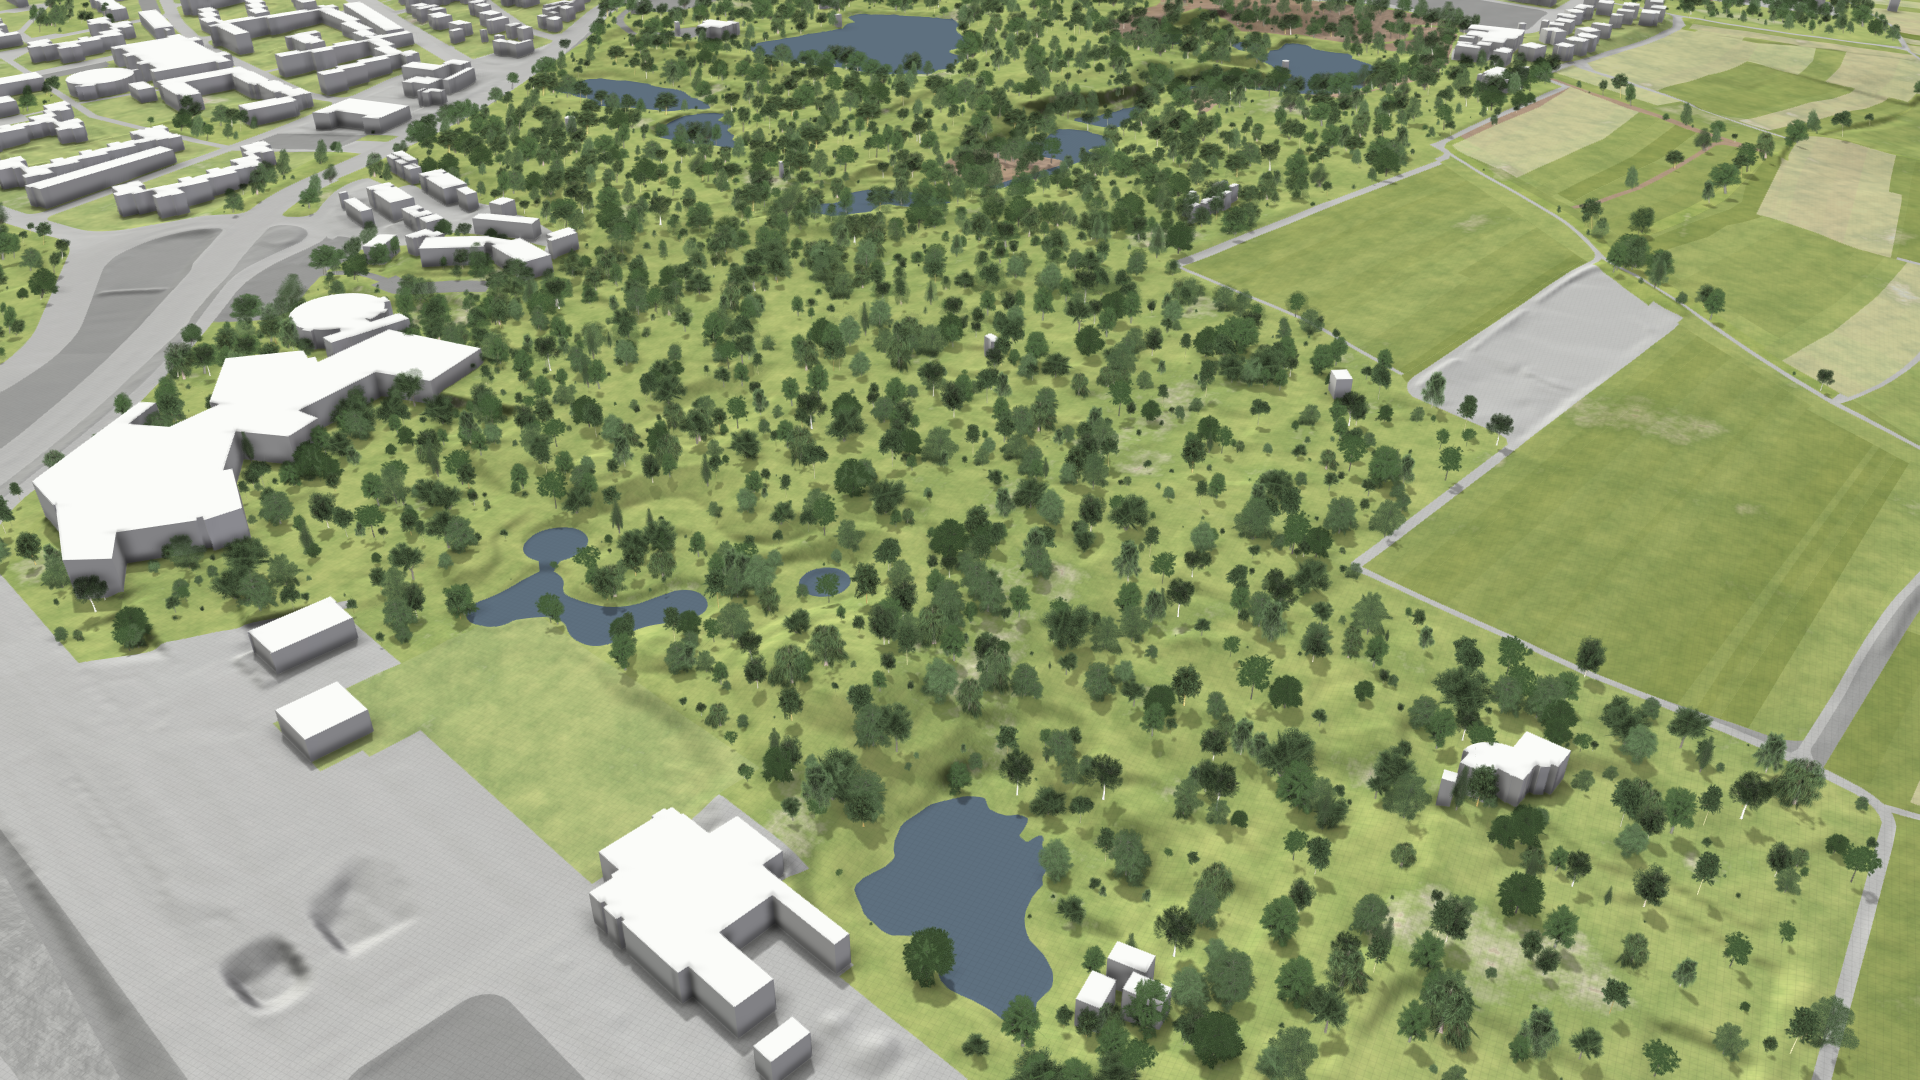
Trees
-
Add three elements to define shape types that should contain trees. Select Wald, verbuschte Fläche, and Freizeitfläche from the drop-down menu.

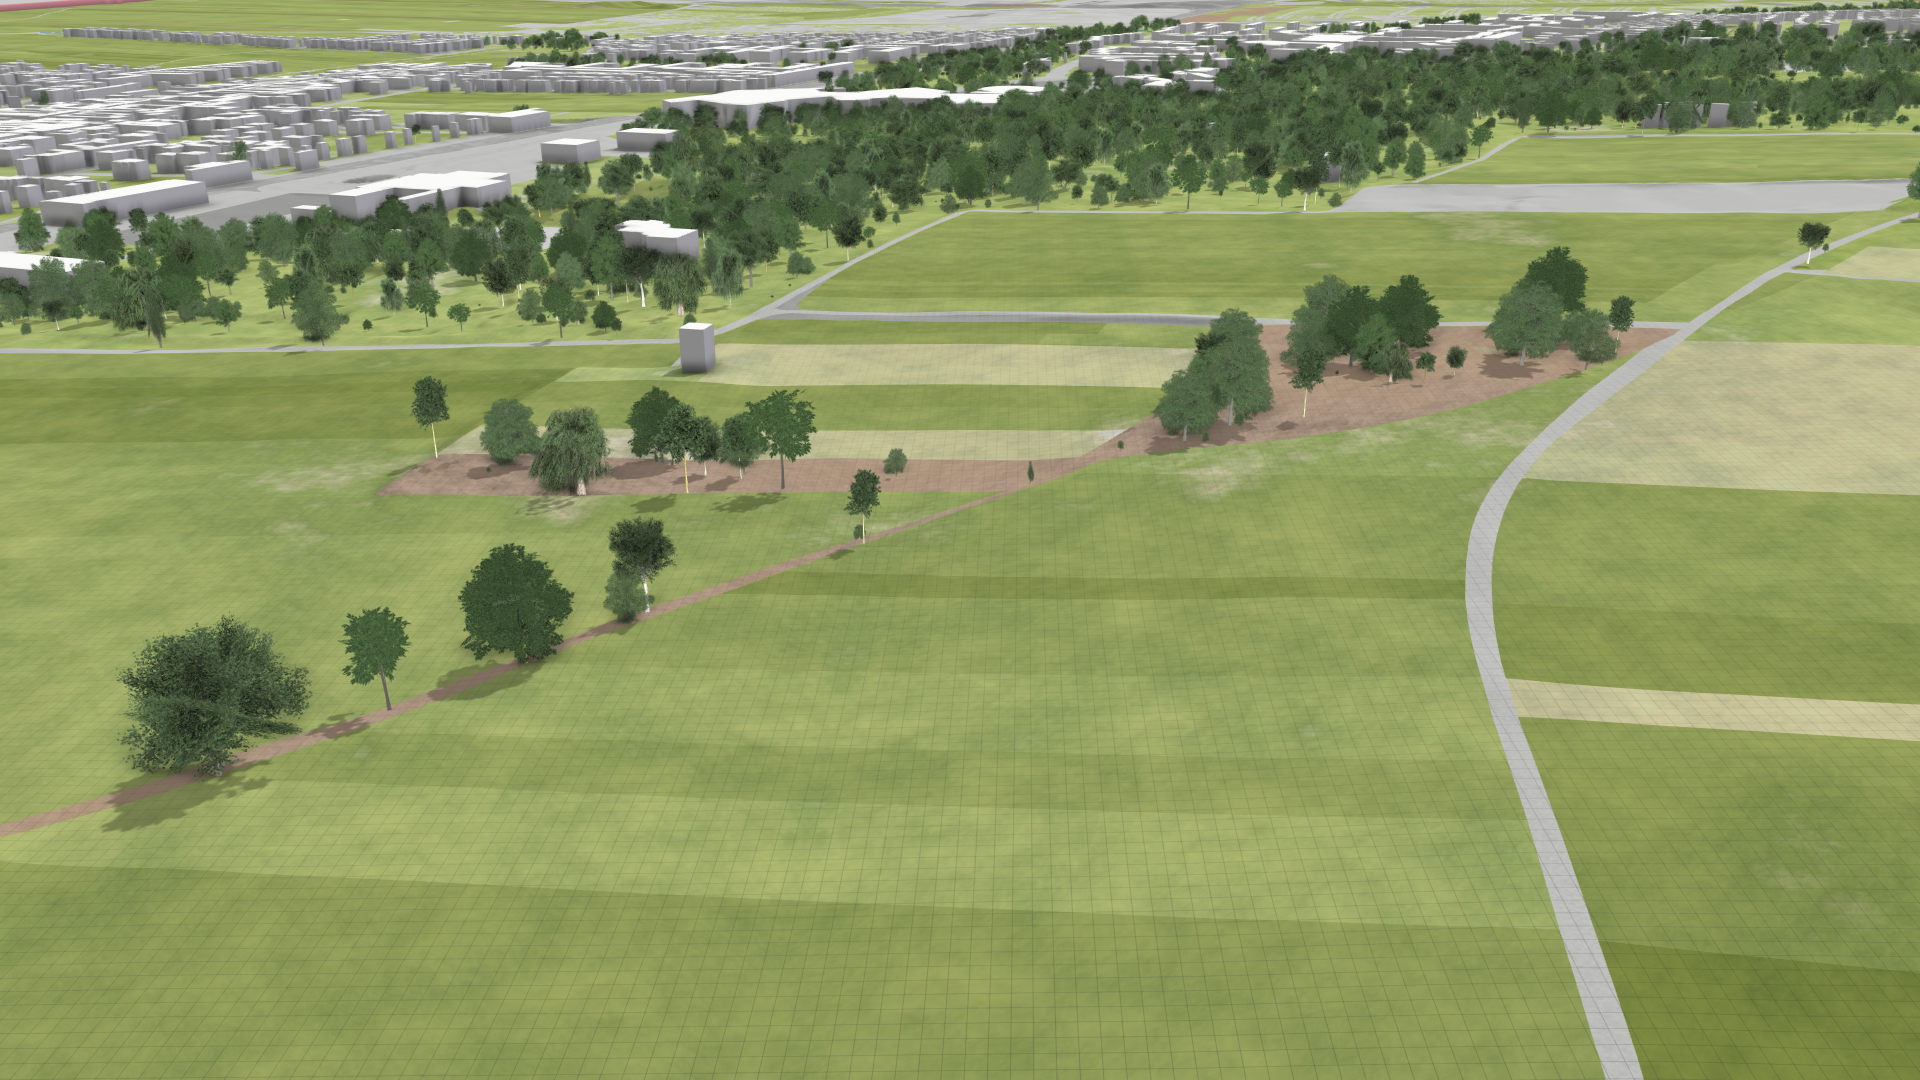
-
Trees are placed on polygons with the selected shape types.
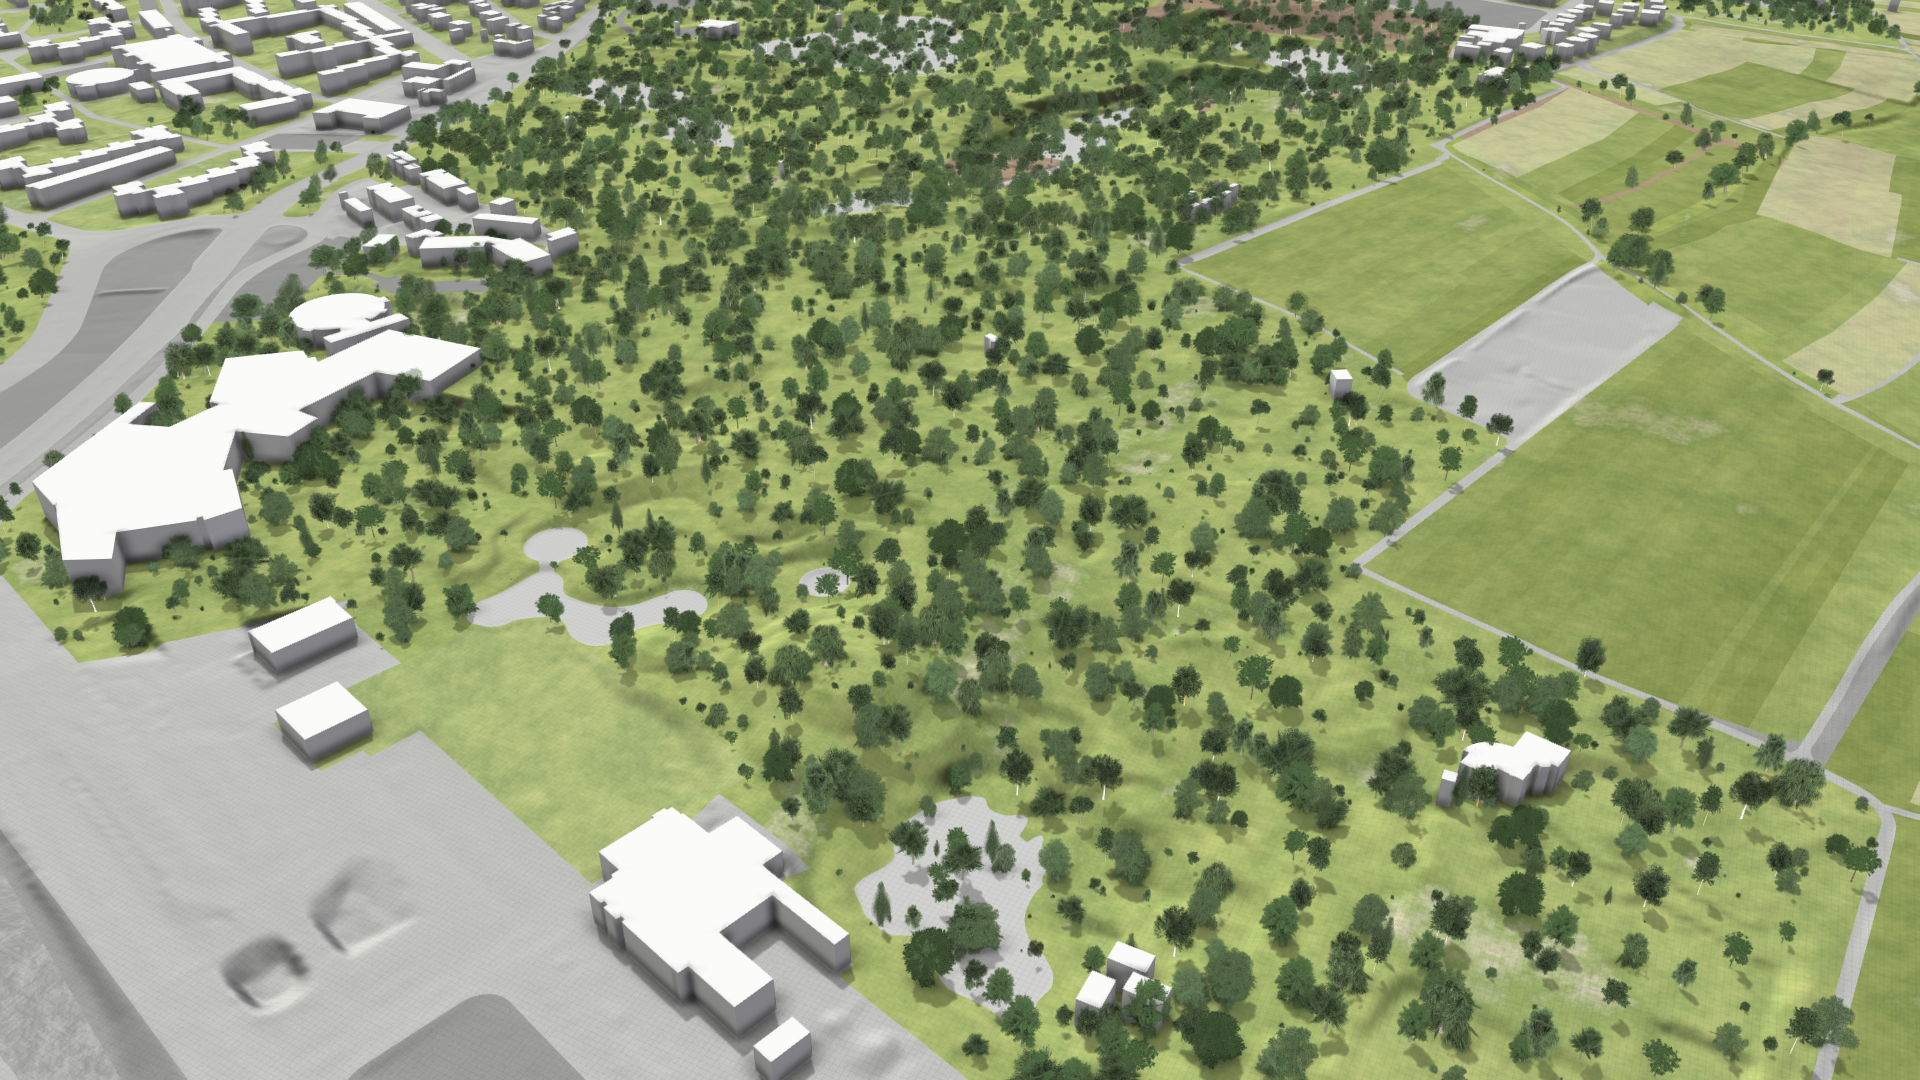
Still Water
-
Select Stehende Gewässer as shape type of still water.

-
Still water polygons are now displayed in dark blue and all trees inside them are removed.
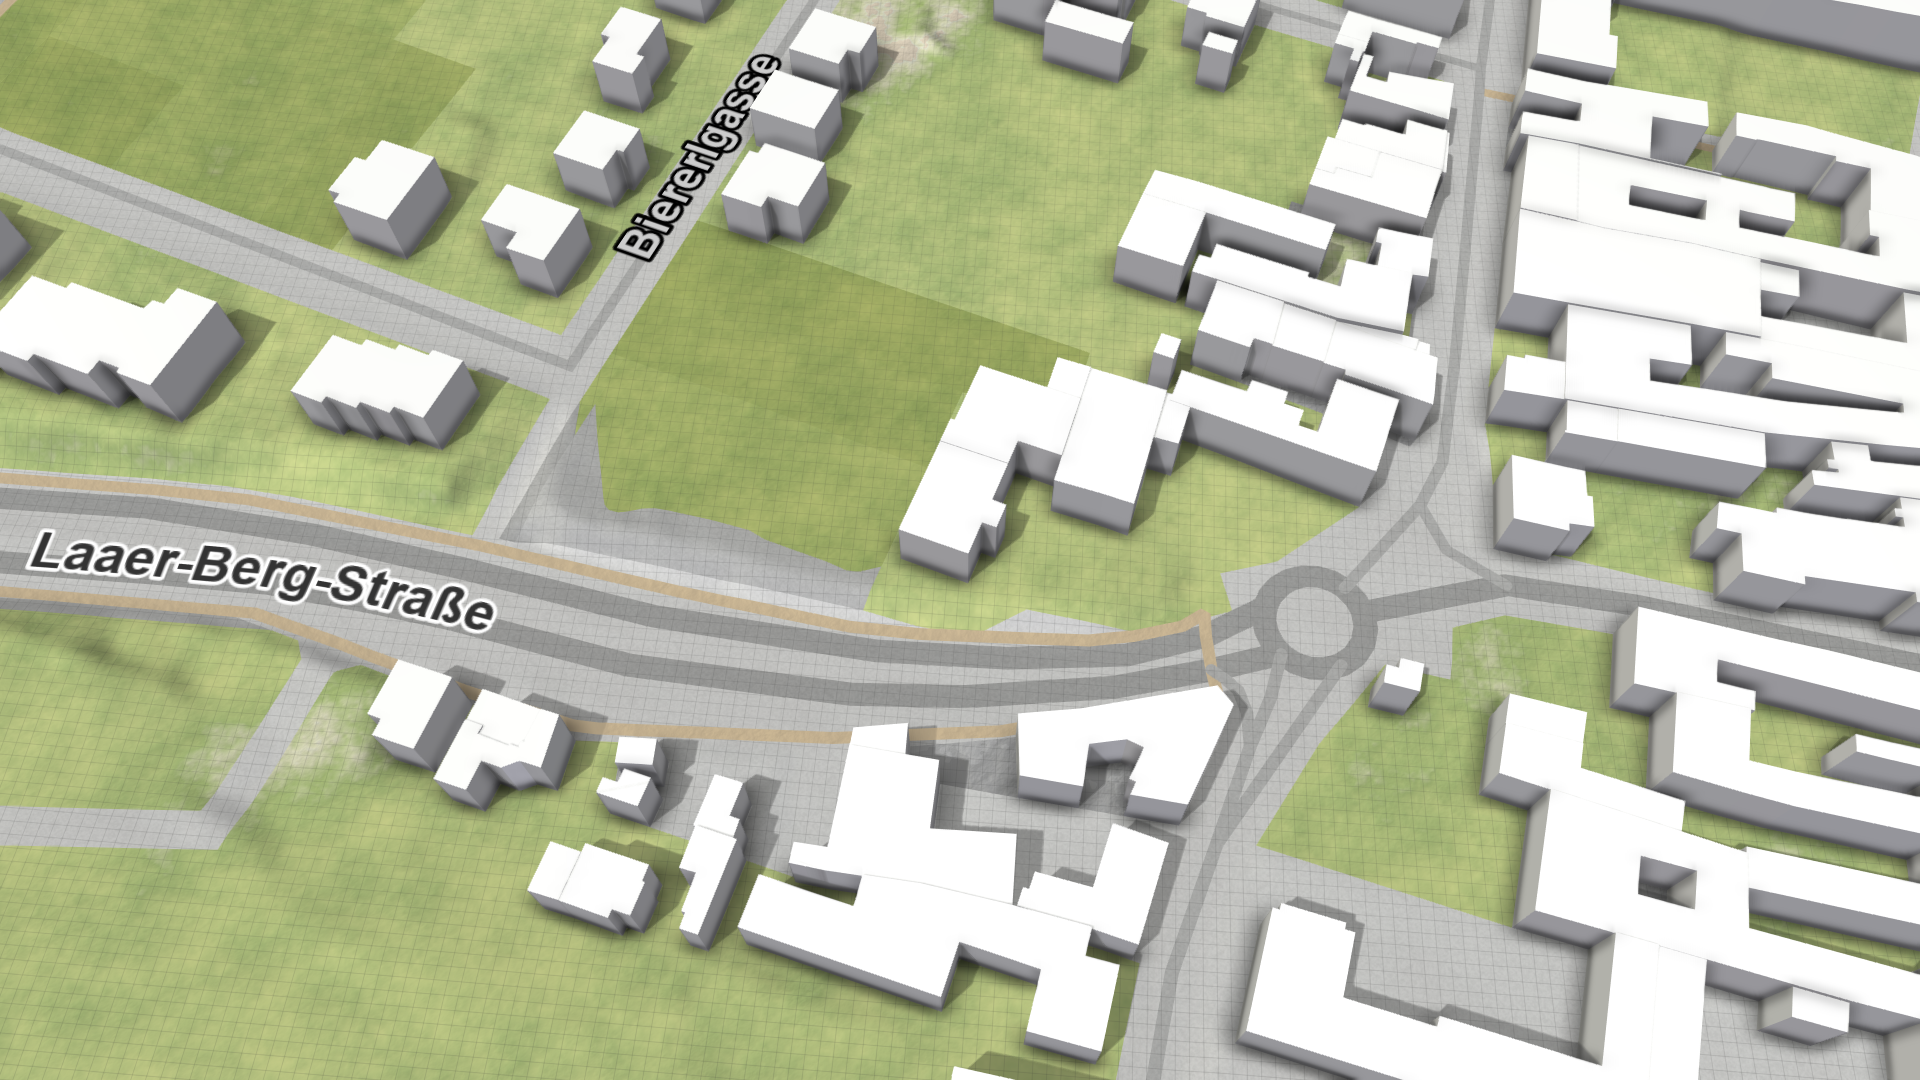
OpenStreetMap (OSM) Data
-
To load roads, specify the data source with a path to the shape file.

-
In this tutorial, we select the gis_osm_roads_free_1.shp file, which contains data about roads in whole Austria.

-
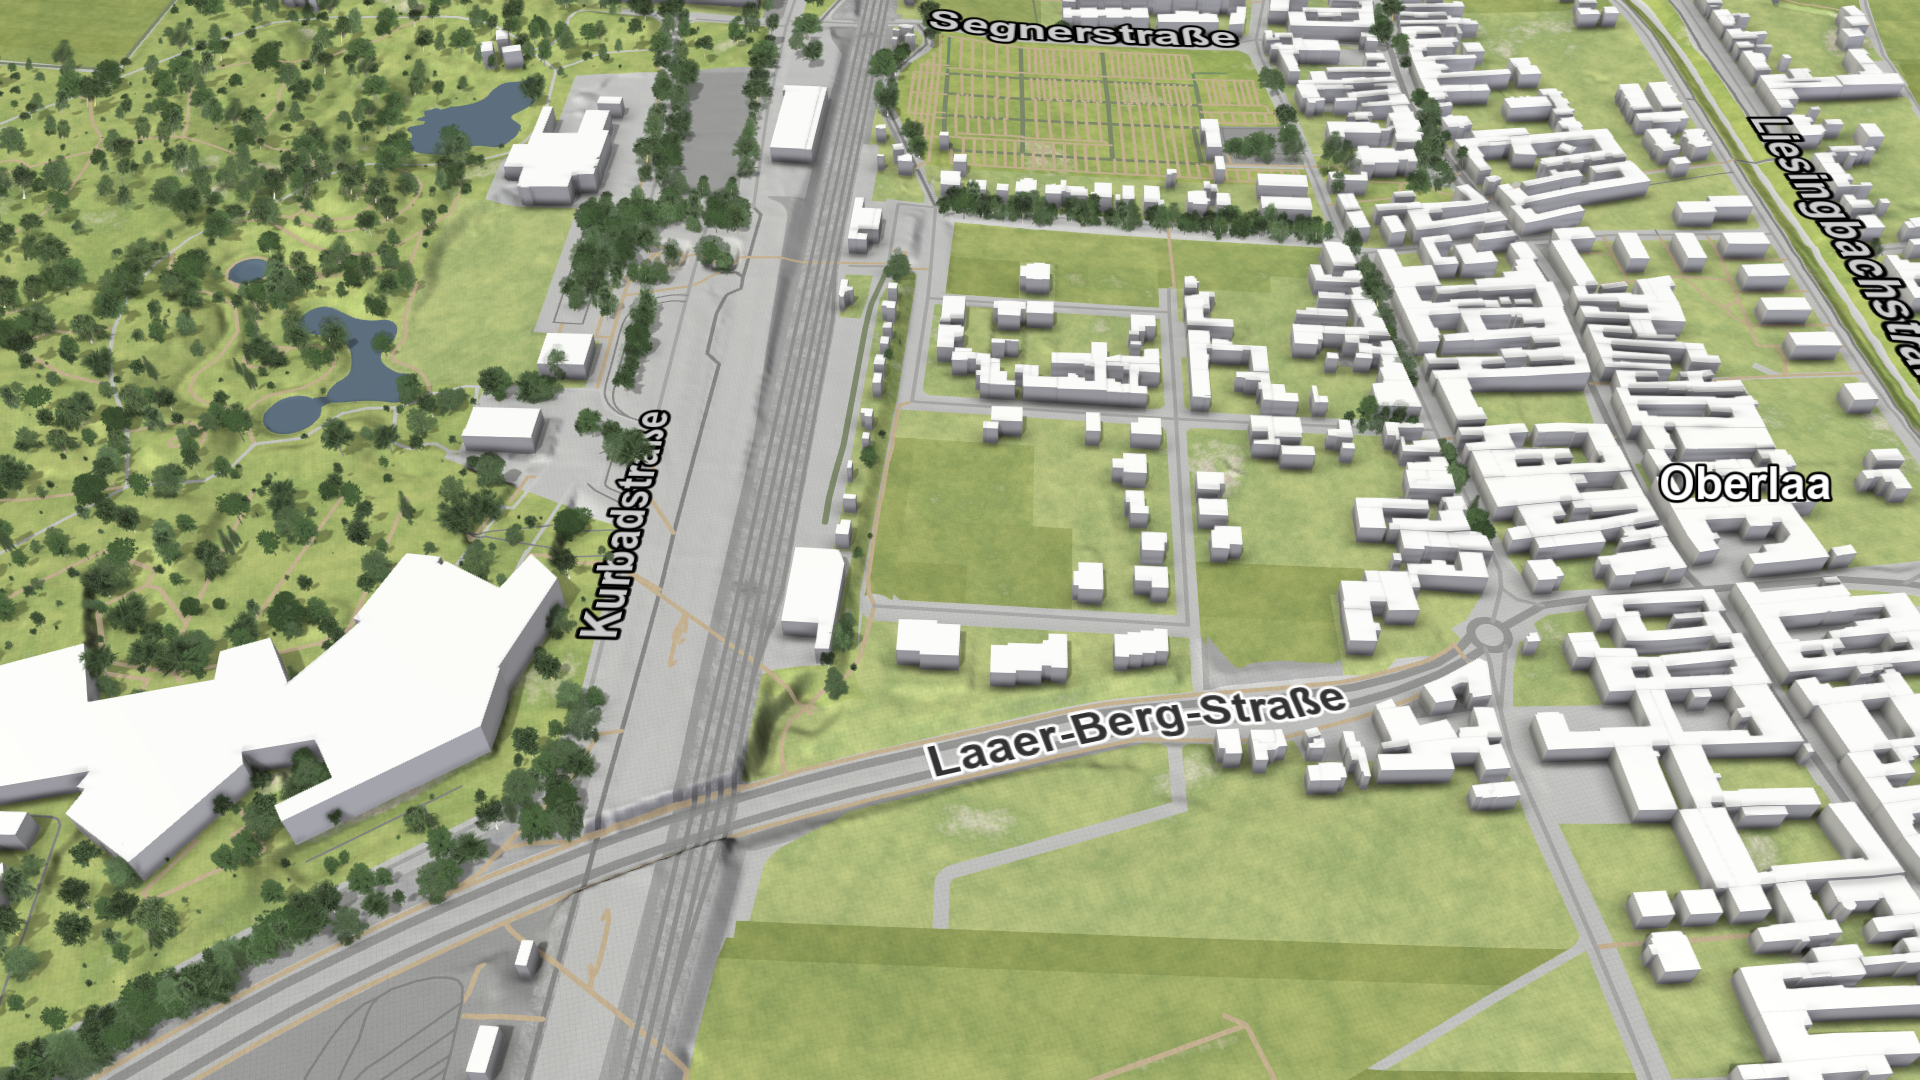
Roads are now displayed by lines projected onto the terrain and labels along them.
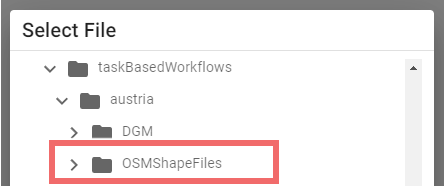
The other OSM data can be loaded the same way as roads by selecting the corresponding file path according to the table below. All file names in the table can be found in the OSMShapeFiles folder.
| Field Name | File Name | Description |
|---|---|---|
| Places (Points) | gis_osm_places_free_1.shp | Places are displayed by labels floating above them |
| Roads (Lines) | gis_osm_roads_free_1.shp | Roads are represented by lines projected onto the terrain with labels along them |
| Still Water (Polygons) | gis_osm_water_a_free_1.shp | Still water (e.g. lakes) are shown as dark blue polygons in addition to still water derived from land use data |
| Waterways (Lines) | gis_osm_waterways_free_1.shp | Waterways (e.g. rivers) are displayed with labels along them |
| Railways (Lines) | gis_osm_railways_free_1.shp | Railways are represented by lines projected onto the terrain |
| Natural (Points) | gis_osm_natural_free_1.shp | Natural features are displayed as 3D tree models |
| POIs for Building Types (Points) | gis_osm_pois_free_1.shp | POIs are used to highlight important buildings with icons and labels |
Hint: If you cannot see the data after setting their file path, they may not be available within the selected simulation domain, such as POIs for important buildings.
The result should look like this, containing places labels, road and railway lines, and additional trees at natural points.
7. Setup Simulation Model
Setup Location: Setup Wizard Panel > Simulation Model
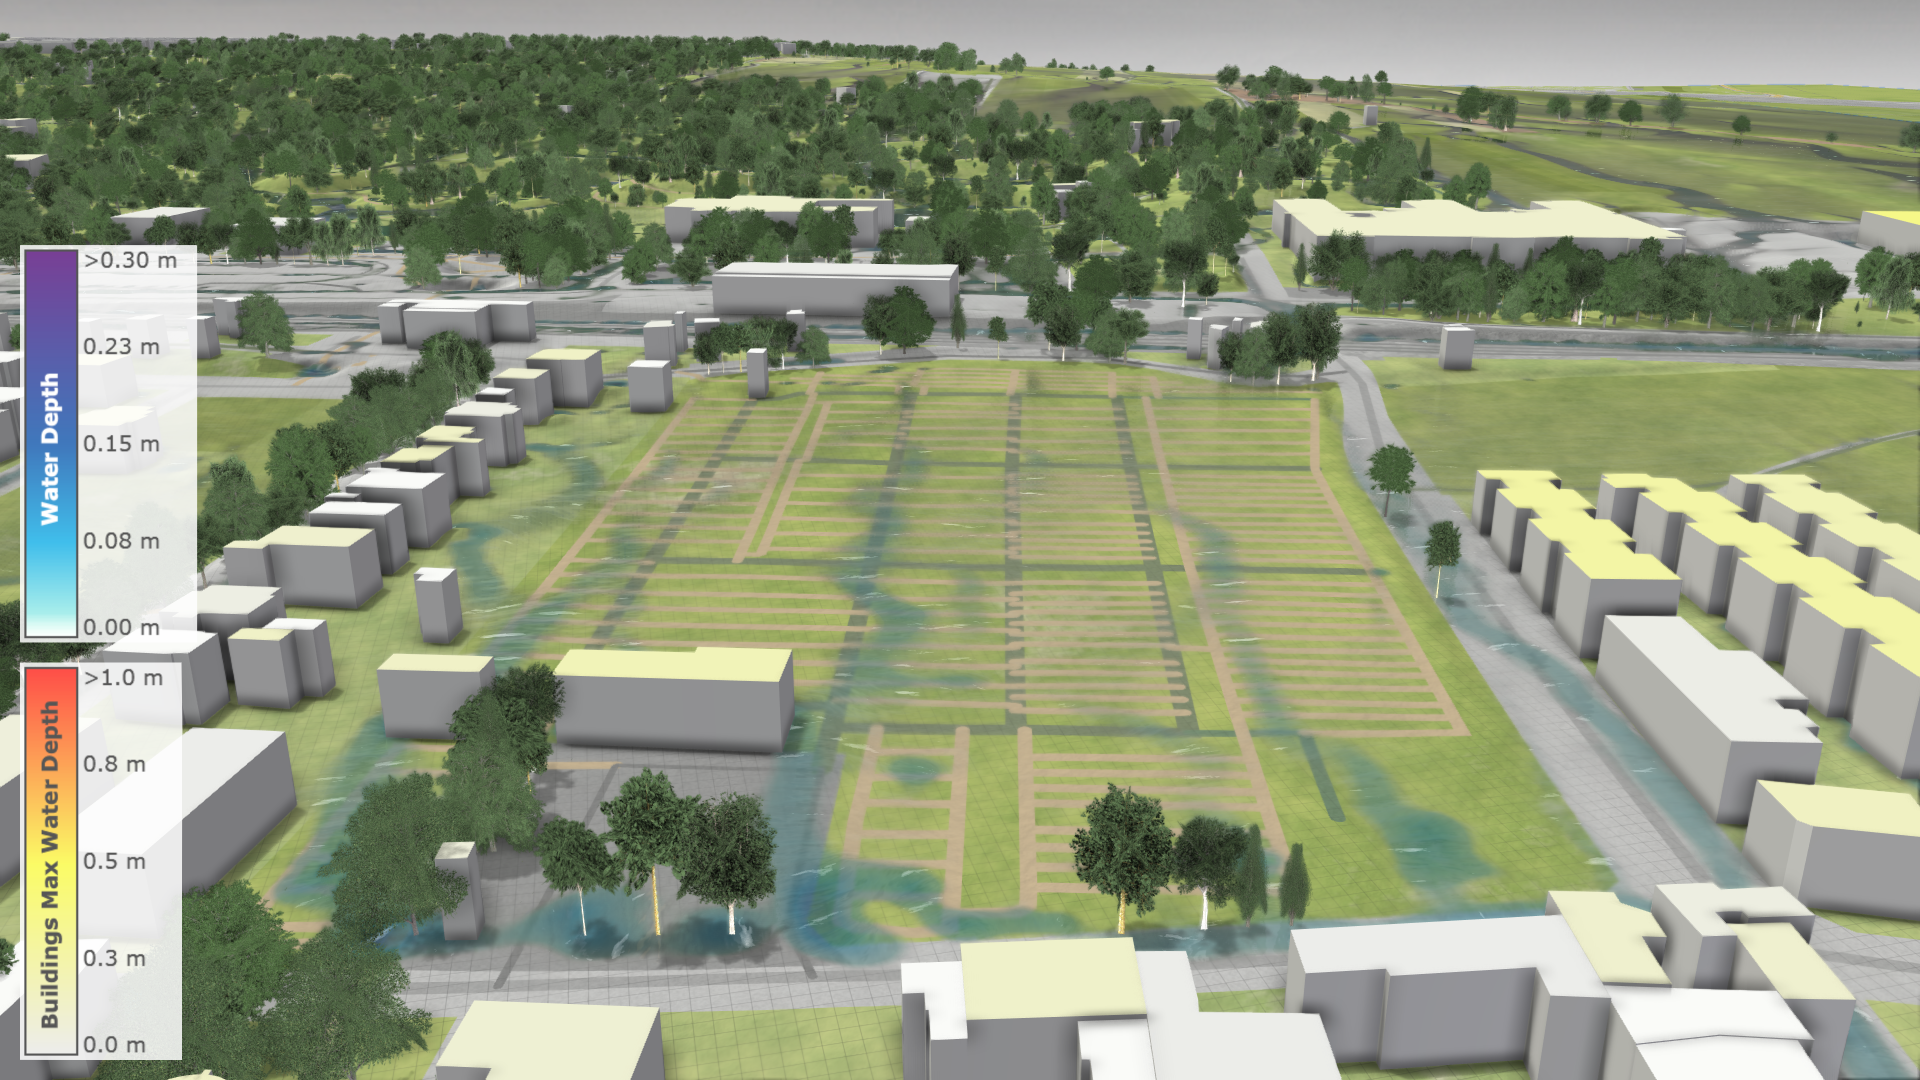
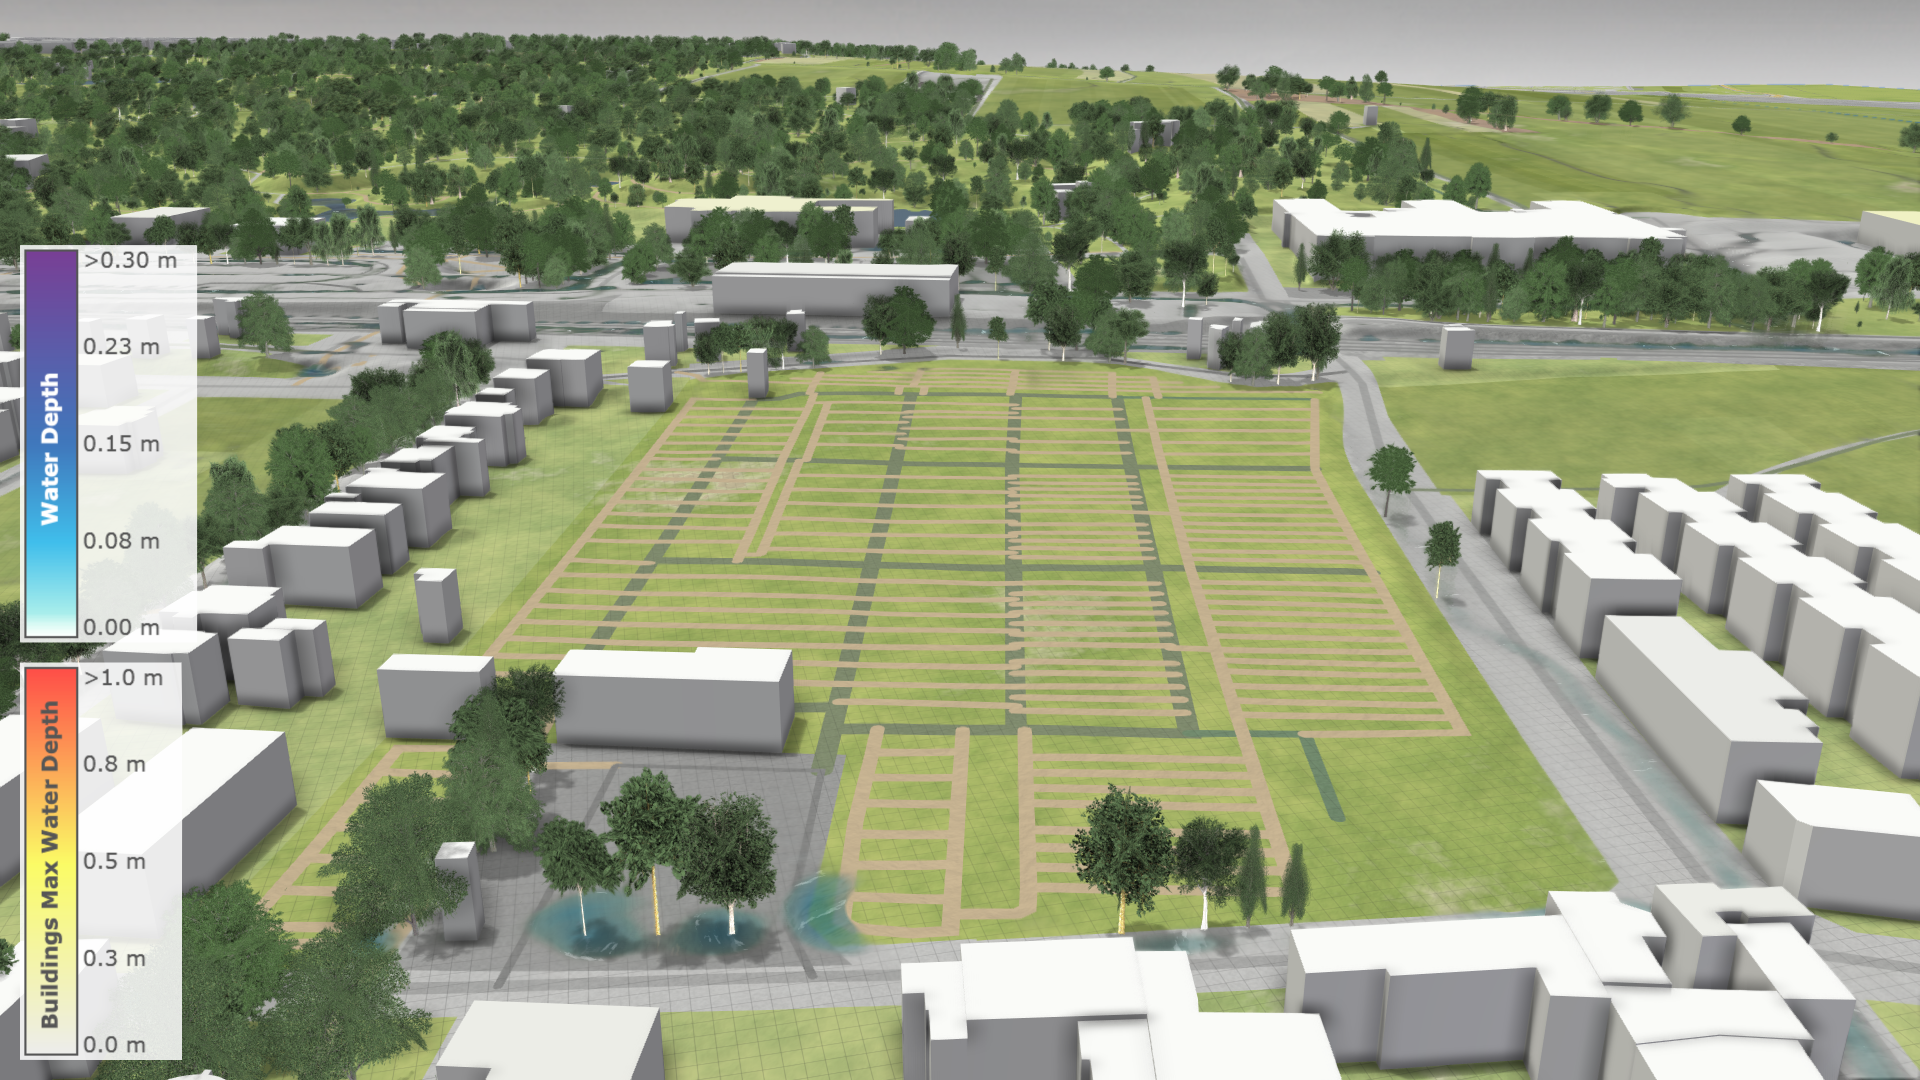
In this category of the setup wizard, you can enable basic simulation components such as rain, interception, and infiltration. To color buildings according their maximum water depth as below, select the visual preset Rain: Default.
Advanced Setups
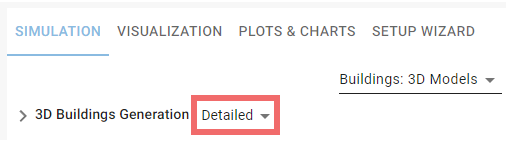
Now we show you how to set up buildings with more detailed 3D models, which are represented by box models with flat roofs by default. This must be done in the Simulation Settings Panel, where all detailed settings for simulation and data are available.
-
Navigate to the Buildings: 3D Models category and change the generation mode of 3D buildings to Detailed.
- Copy the following code to the Source coordinate system field and click Apply
EPSG:31256
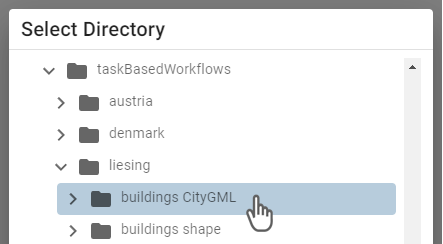
-
Set buildings CityGML as directory path for the detailed buildings
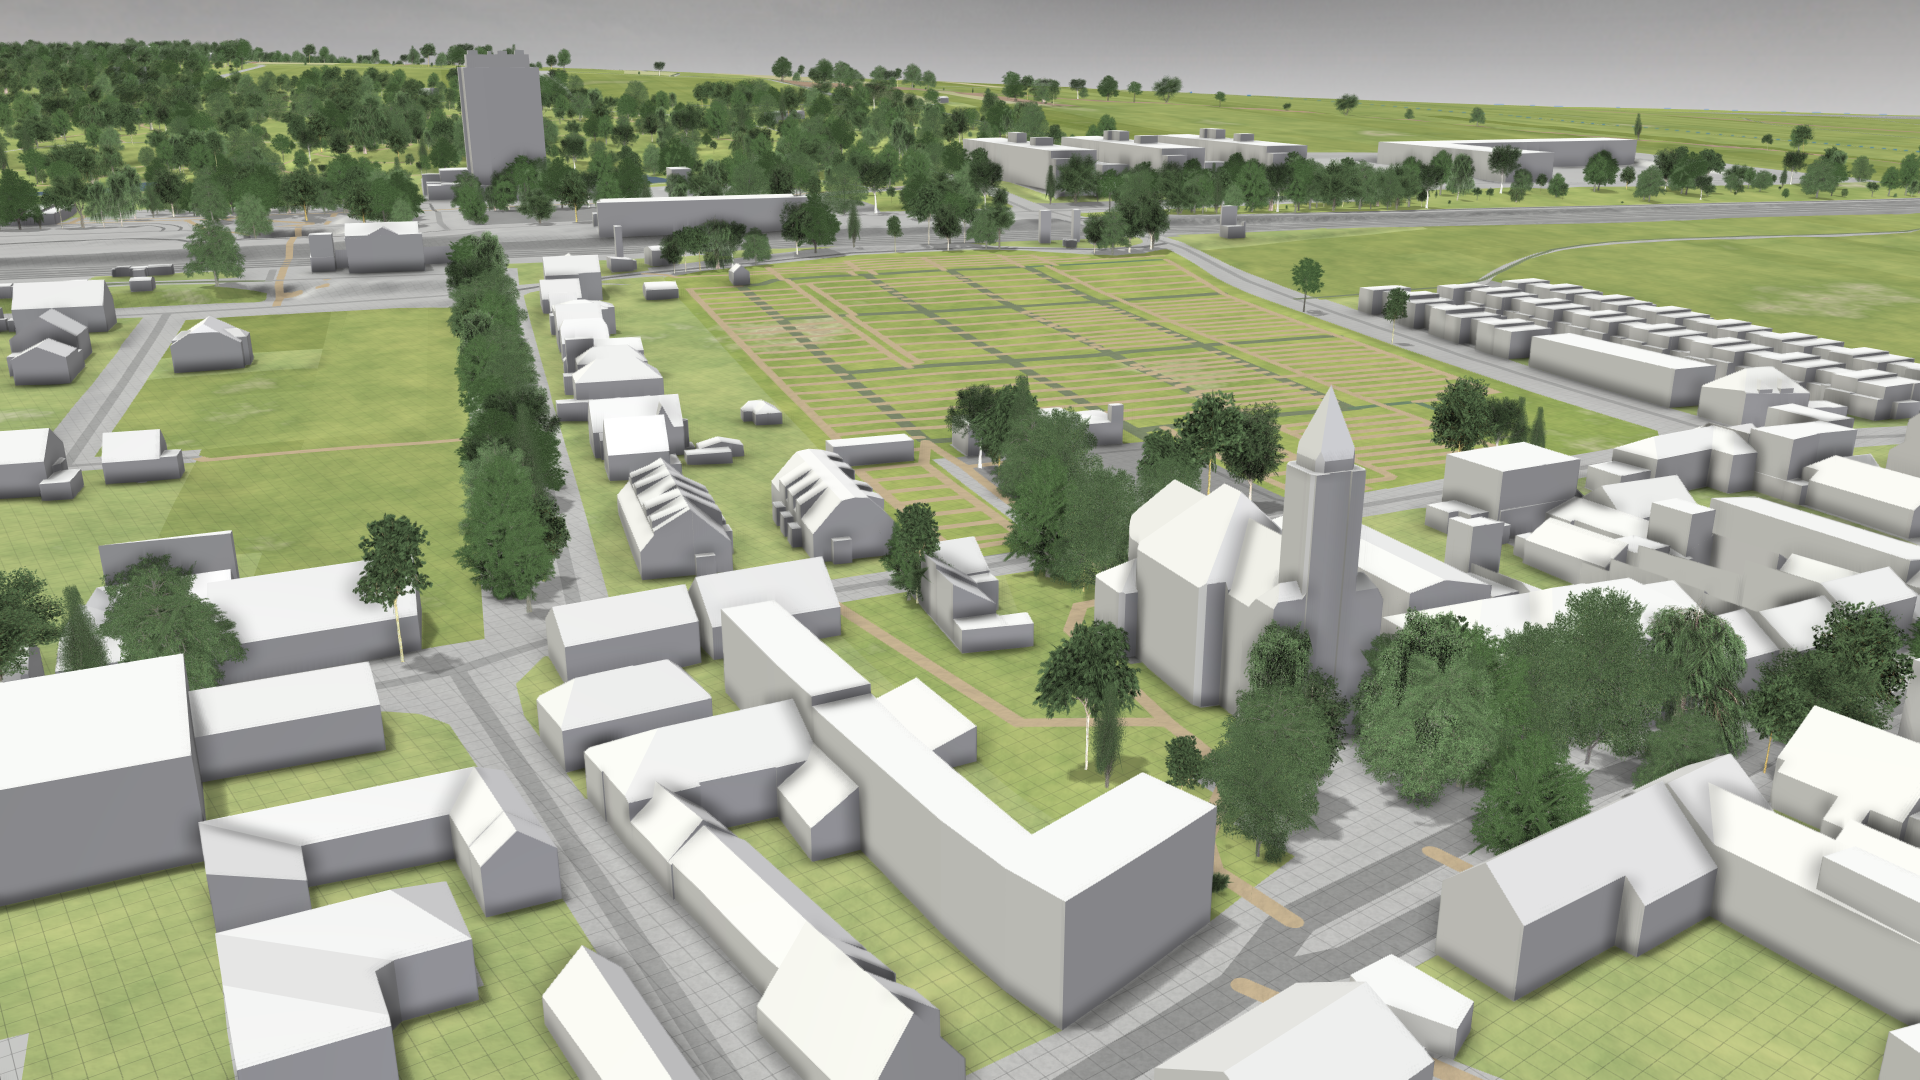
- After applying your changes with the Run button, the building models are loaded. This can take some time because all 3D models have to be matched with the existing building footprints to replace the default box models by the new ones.
Hint: If you need to integrate additional or more complex data into your model, proceed to the Advanced Setups section. To integrate a sewer network into your project, see the Sewer Network Setups section.