Plots & Charts
The Plots & Charts Panel can be found at the bottom of Scenario Setup Pane:

There are several categories available:
Water Balance
Provides the user with insights into the water volume balance across various model components. Water volume balance tracking is controlled by the "Track Water Balance" checkbox. This option is deactivated by default due to its high computational cost during simulation. To compute the water volume balance, activate this option. It is recommended to deactivate it once it is no longer needed.
- Bar Chart: The category "Water Balance: Bar Chart" displays bar charts of cumulative water volumes for both the surface and sewer network along with a relative error estimate. The water volume balance condition requires that the two bars in each pair are of equal length:

When hovering over the bar charts, accurate values for the corresponding water volume balance components are displayed. - Plot over Time: The category "Water Balance: Plot over Time" displays plots of water volumes over time, showing only the components selected in the popup menu on the left. The plots can offer a clear visual indication if the water volume balance is incorrect:

Hint: The exact values from the water balance bar charts can be exported in JSON format by clicking the button in the top left. The water balance plot offers export options both as an image or in CSV format.
Inspection
The plots here are linked to Inspection actions. The "Inspection: Profile" plot, for example, displays water and terrain levels along the line defined by a "Profile Inspection" action:
| Profile Inspection Action | Inspection: Profile |
|---|---|
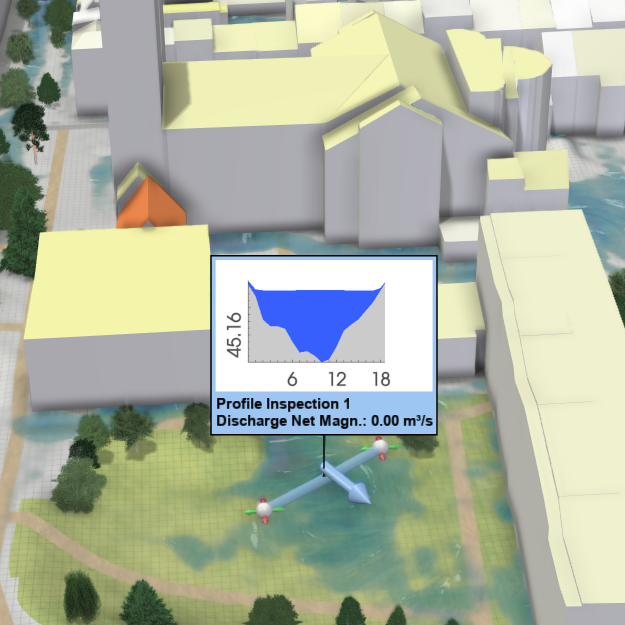 |
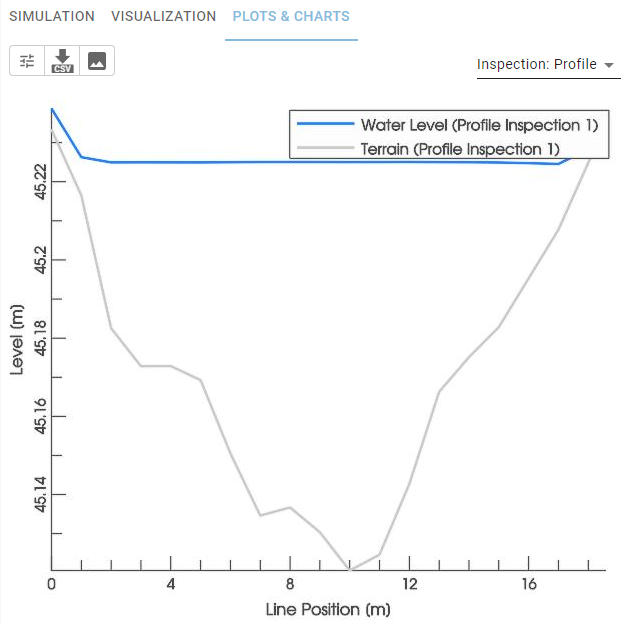 |
The "Inspection: Water Depth" plot, on the other hand, generates water depth plots over time for "Spatial Inspection" or "Building Inspection" actions created by the user:
| Spatial Inspection Actions | Inspection: Water Depth |
|---|---|
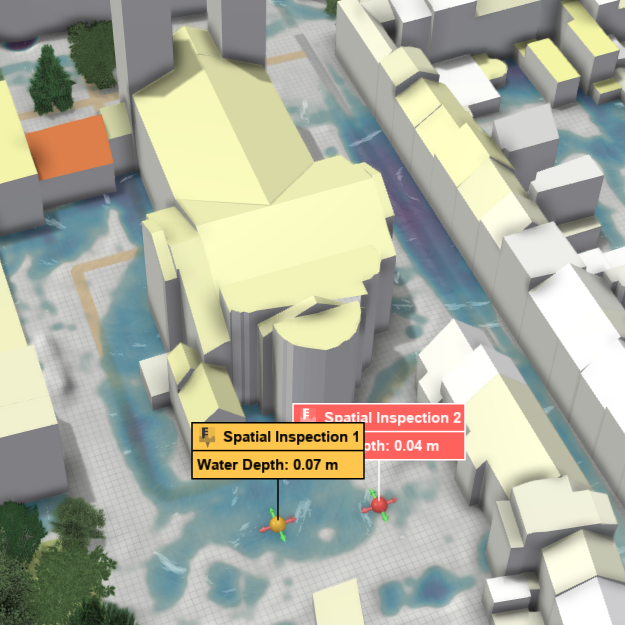 |
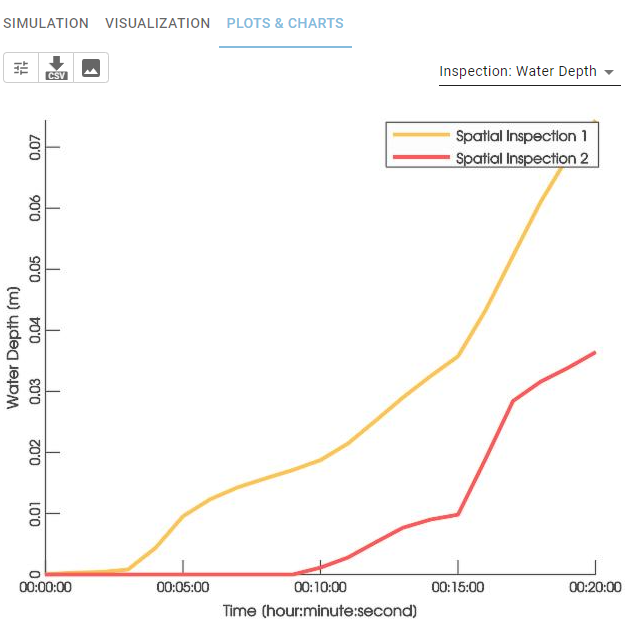 |
Rivers and Streams
Displays plots associated with "Inflow" and "Outflow" actions from the "Rivers and Streams" category, including water levels over time, discharges over time, and rating curves.
Surface and Soil
In the "Surface and Soil: Rain, Interception, and Infiltration" category, the user can display time-based plots of the corresponding components by selecting them from a popup menu. For example, this includes plots of precipitation rates and zonal interception rates per zone type:

The "Surface and Soil: Simulation Statistics" category offers key information and metrics related to the current simulation.
The "Surface and Soil: Potential Damage" category provides a plot of all summed potential damage within the simulation domain over time, estimated using BEAM data (see Potential Damage Estimation with BEAM for further information).

Hint: All provided plots and charts come with options to export them as data files or images.