![]()
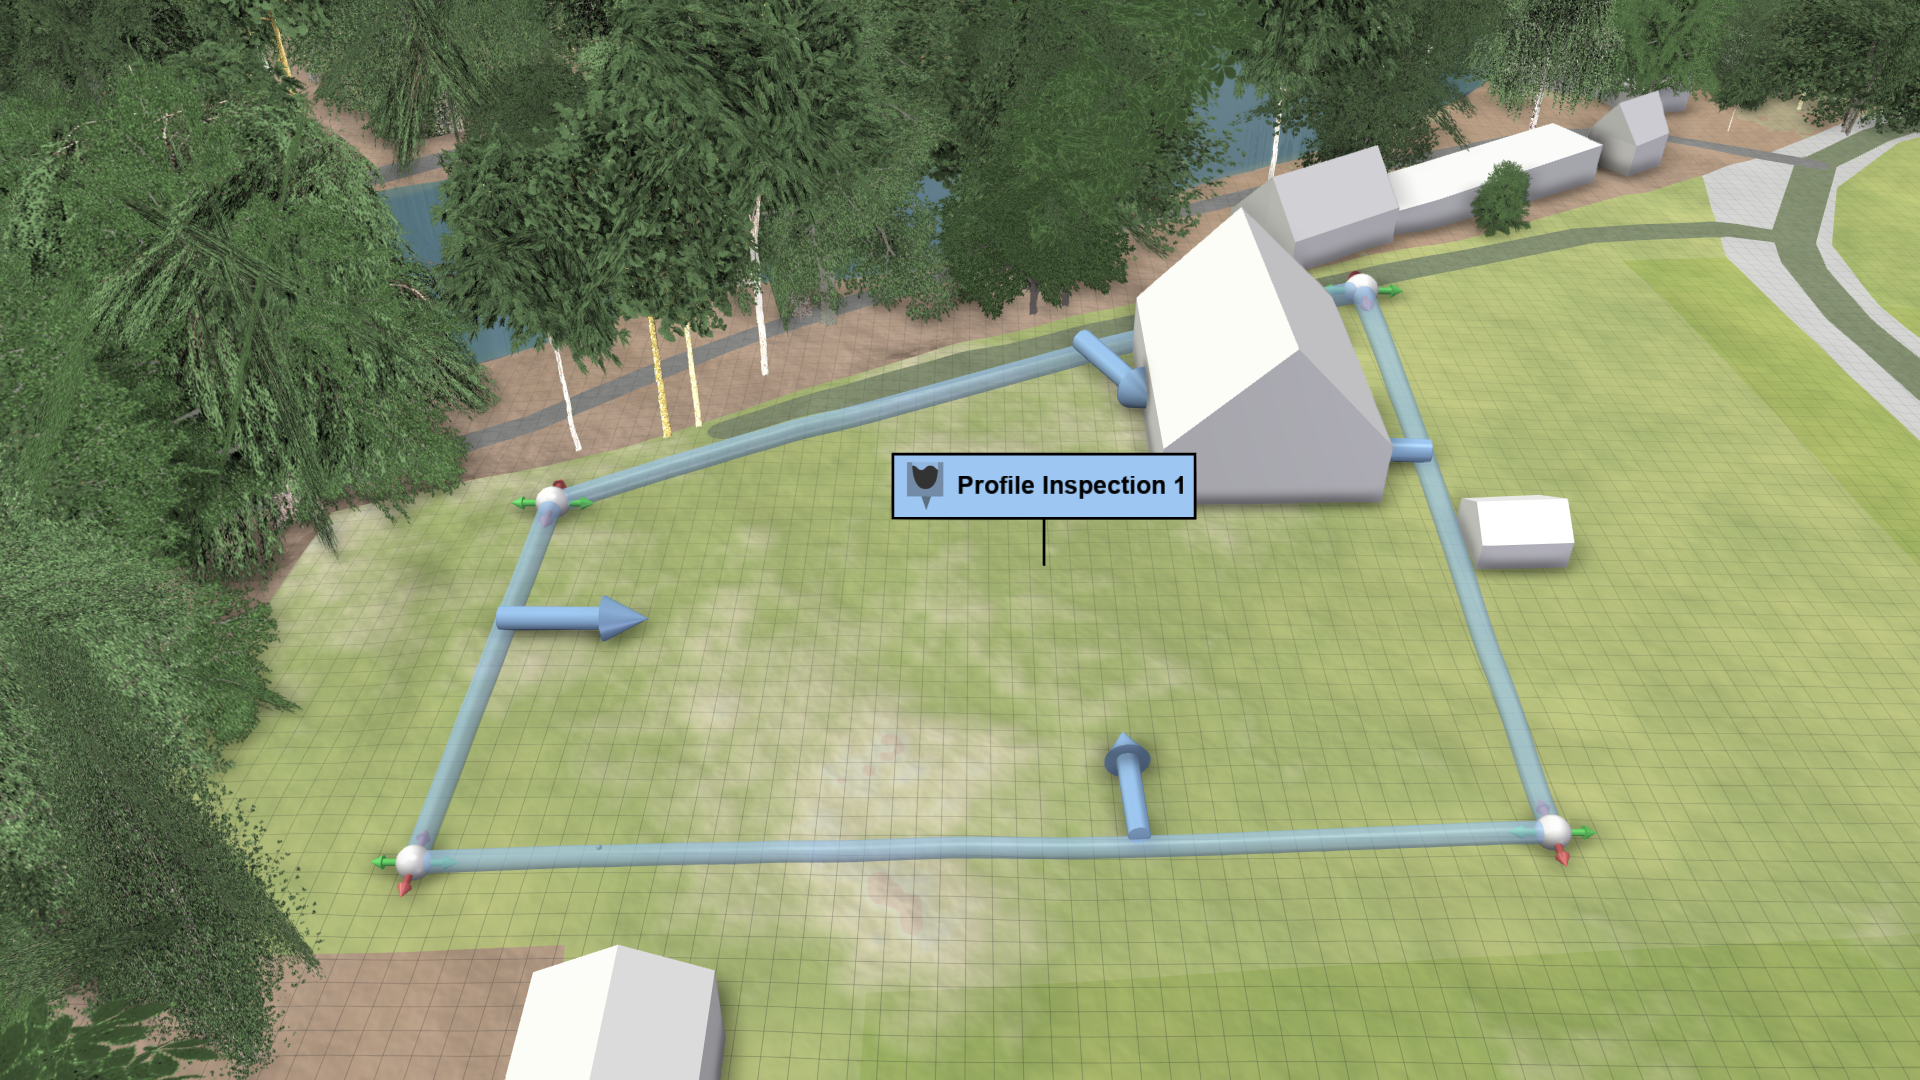
Profile Inspection
Creation Mode: Draw Line on Terrain (not allowed on scenarios with start time > 0; supports loading from file)
Purpose and Effect: This action extracts local information along a line that represents the profile of a river bed, a basin outline, or a premises outline. The Action Tool Panel contains a table that lists all available display options, such as water depth, inflow/outflow volume, and the discharge, which is shown by default.

Hint: Profile Inspection actions can only be stored in scenarios that start at time step 0. For more details on how they are saved, refer to Action Storage.
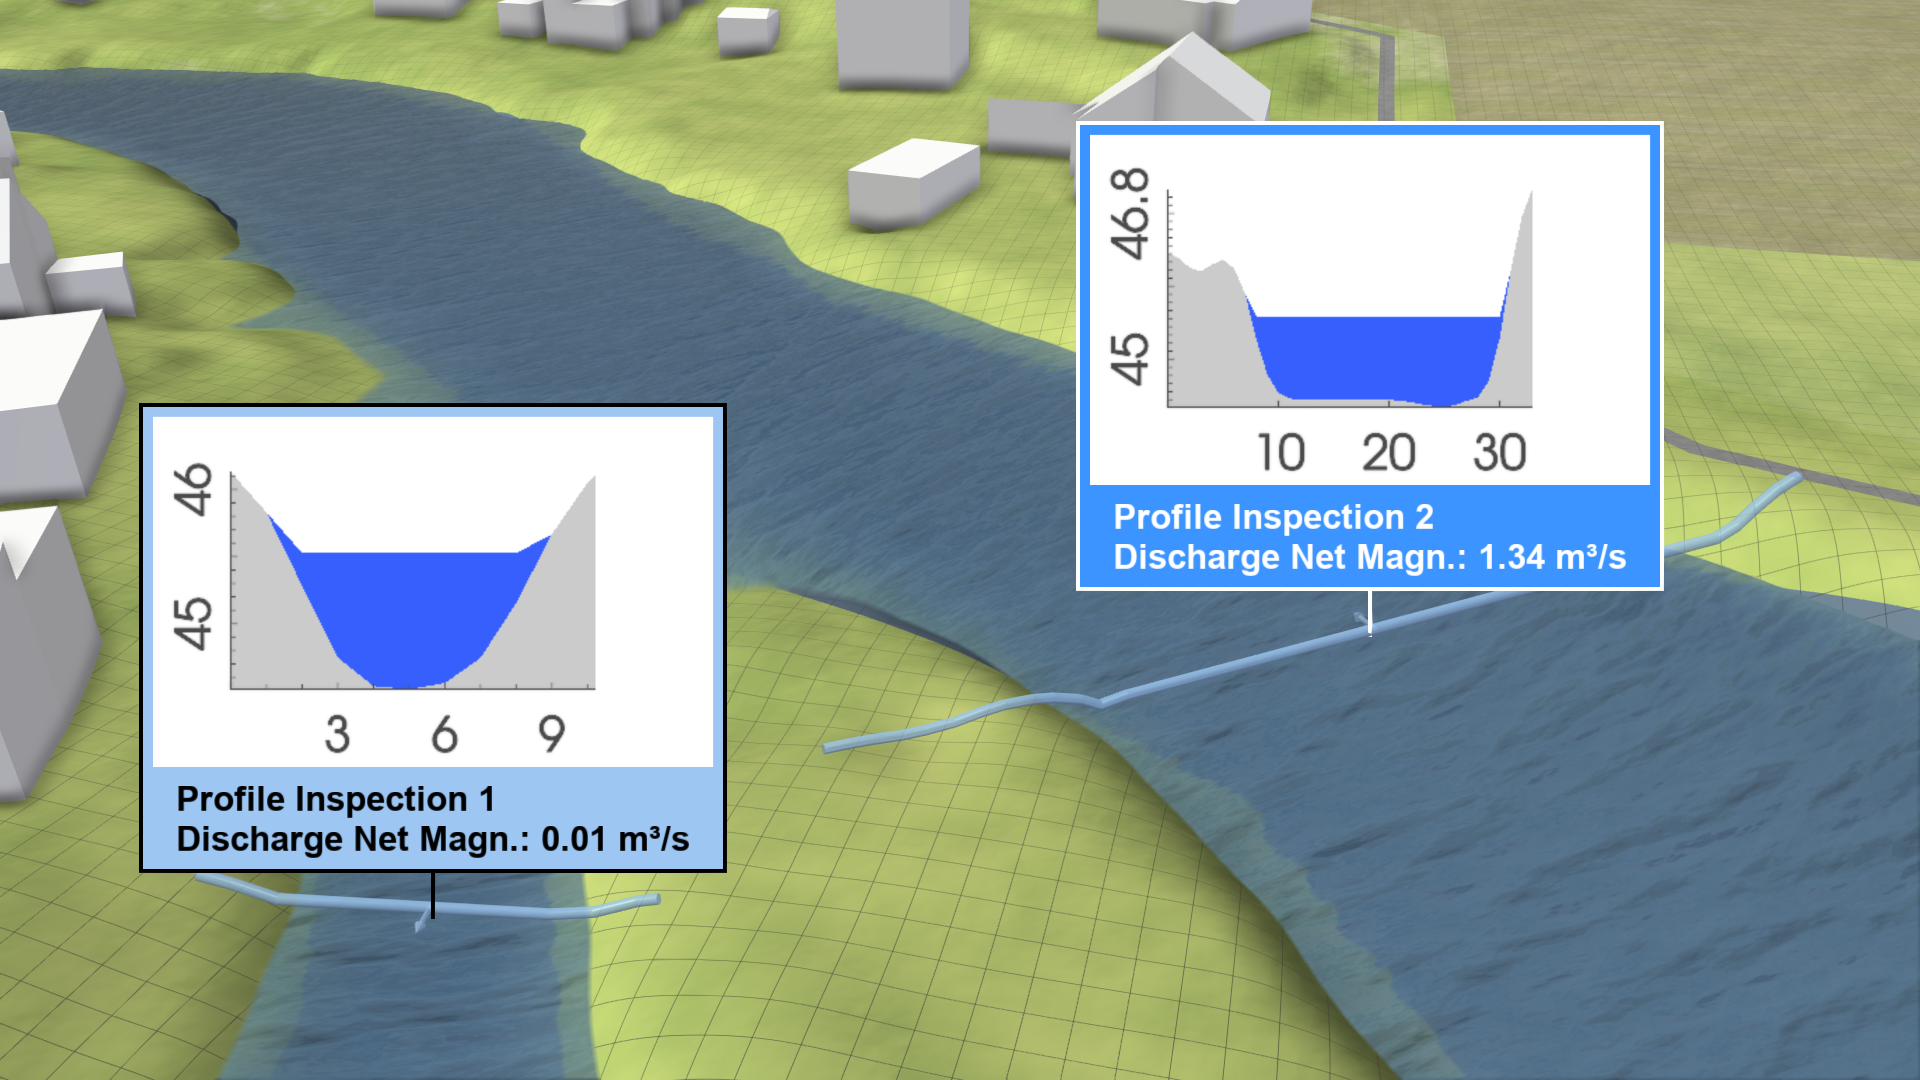
Inspection Label
A label displaying the inspected data values for the profile can be shown. The data to inspect can be selected in the Labels section of the Action Tool Panel.

Computation Accuracy
By default, the values are computed in a post-process, providing a fast approximative result based on the time step size of the active scenario. The Sampling category in the Action Tool Panel provides a setting to adjust the step size of the sampling along the profile line to the desired resolution. In the Action Settings Panel, you can enable high-accuracy calculations for more precise results, computed along the cell interfaces using the internal simulation solver and its time step size. Note that switching to high accuracy will invalidate the simulation cache and trigger a re-simulation.

Hint: The cell interfaces that are used for the high-accuracy computations can be displayed in the Action Tool Panel under the Sampling category.
Customize Profile Inspections
Color and Arrow
In the Visualization Settings Panel, you select which attribute is mapped to the color of the profile and to the direction and size of the profile arrow using a drop-down menu.

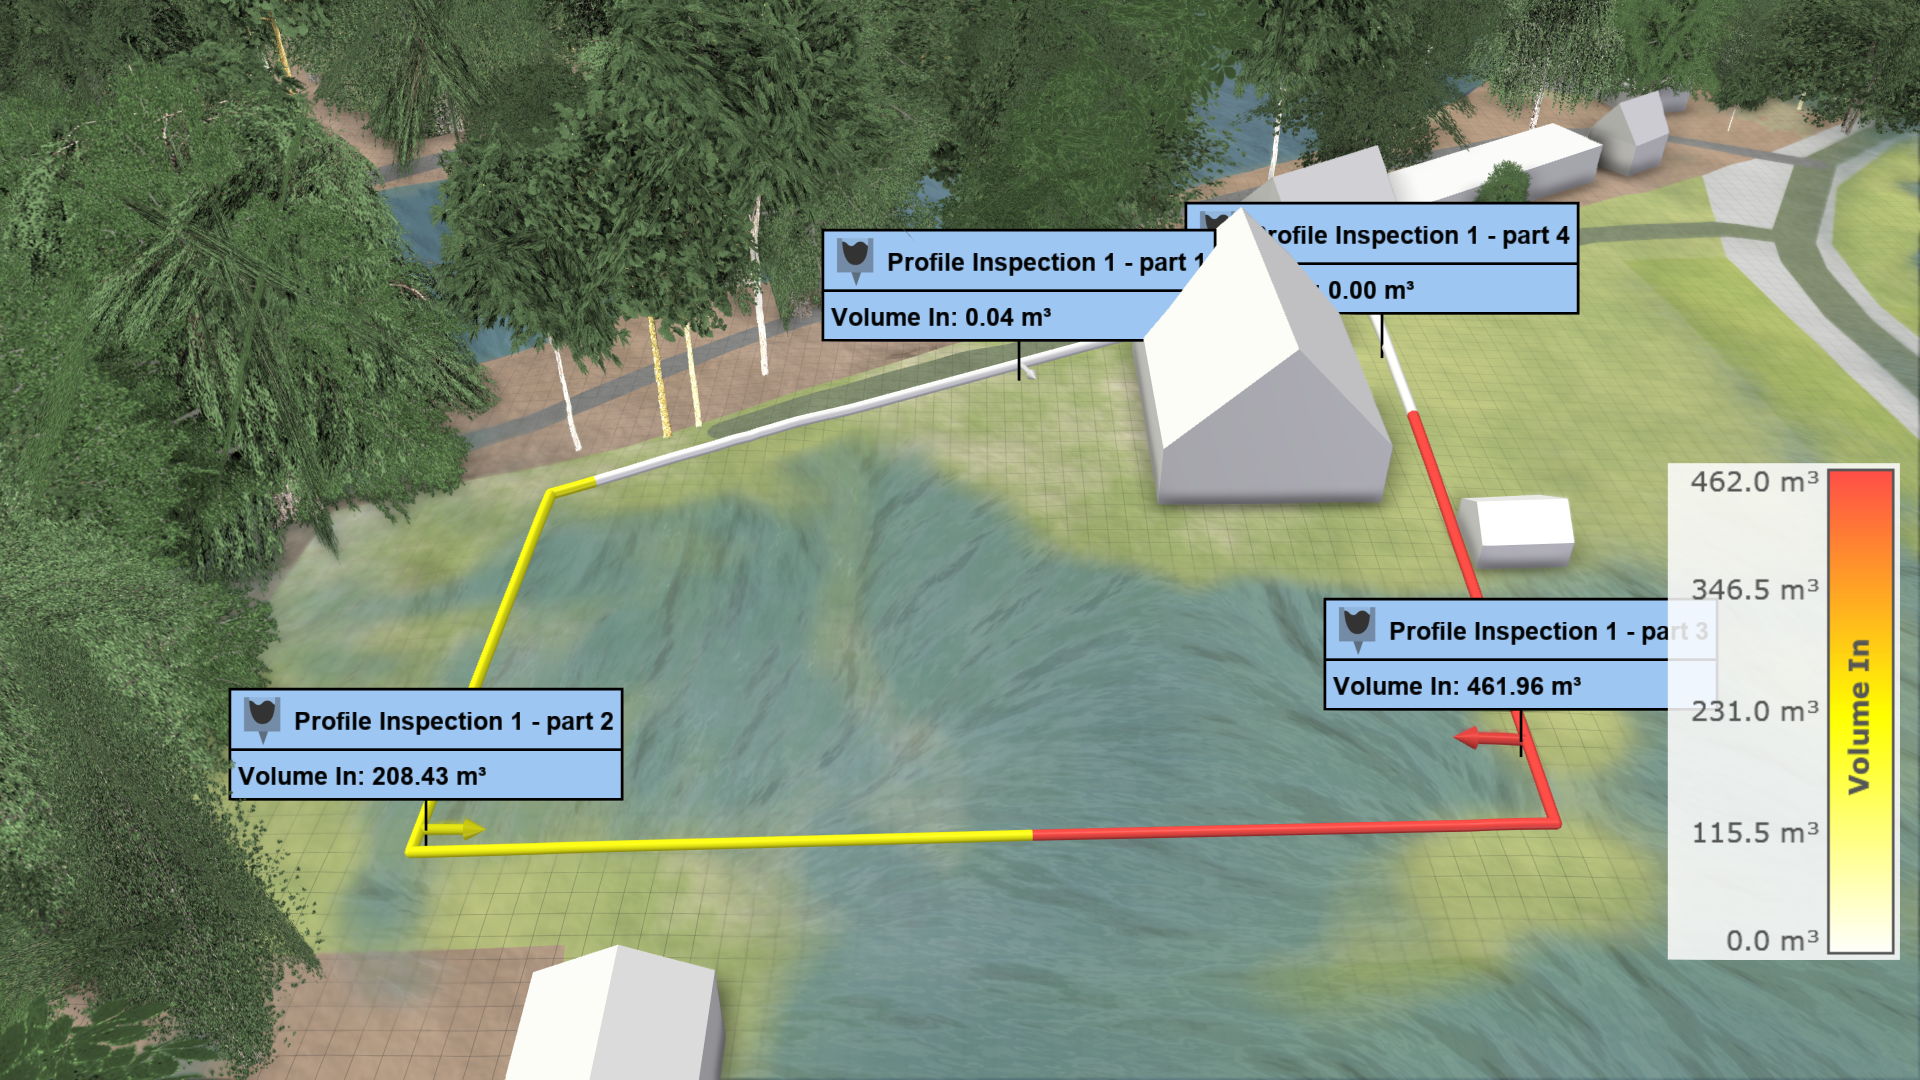
Influence of Drawing Order
When drawing profile lines, the order in which the control points are placed determines which side is considered as inside and outside. This information is used for inflow and outflow computations. The left side of the profile line is always considered as inside. In edit mode, you see an arrow always pointing inward. The image right shows a closed profile line drawn counterclockwise, with arrows pointing inward. They indicate that inflow volumes are calculated for the area within the premises.
Subdivision of Profiles
By default, all values are calculated along the whole profile line. If you want to focus on subsections, the line can be divided according to the subdivision length of the action settings. This option must also be enabled in the Action Settings Panel. The visual preset Surface: Subdivided Profile Discharge is useful for many subdivisions, as it displays smaller labels that do not overlap. The following examples show the inflow volume of water to a premises (Volume In) represented by a closed inspection line.
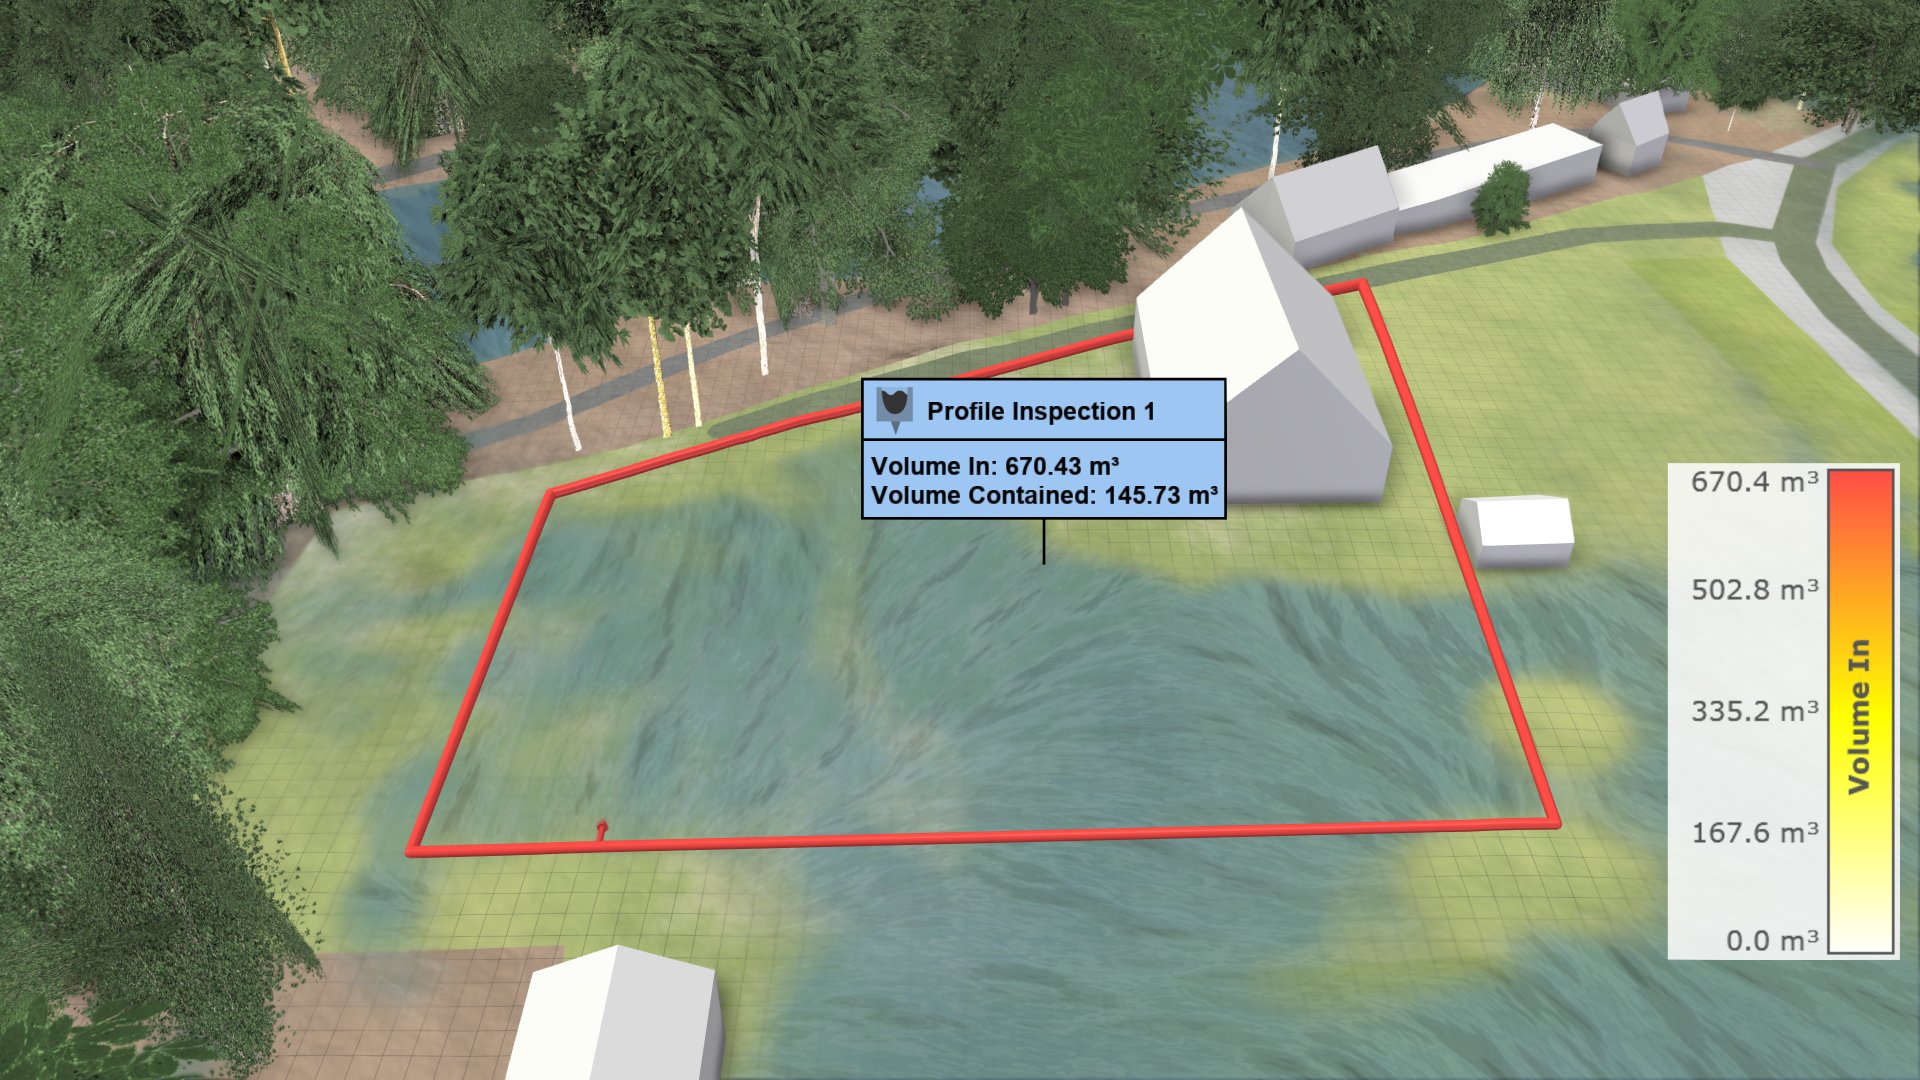
Hint: For closed profile lines, the contained volume is available and can be displayed by enabling Volume Contained in the Action Tool Panel.
 Subdivision length: 50 m
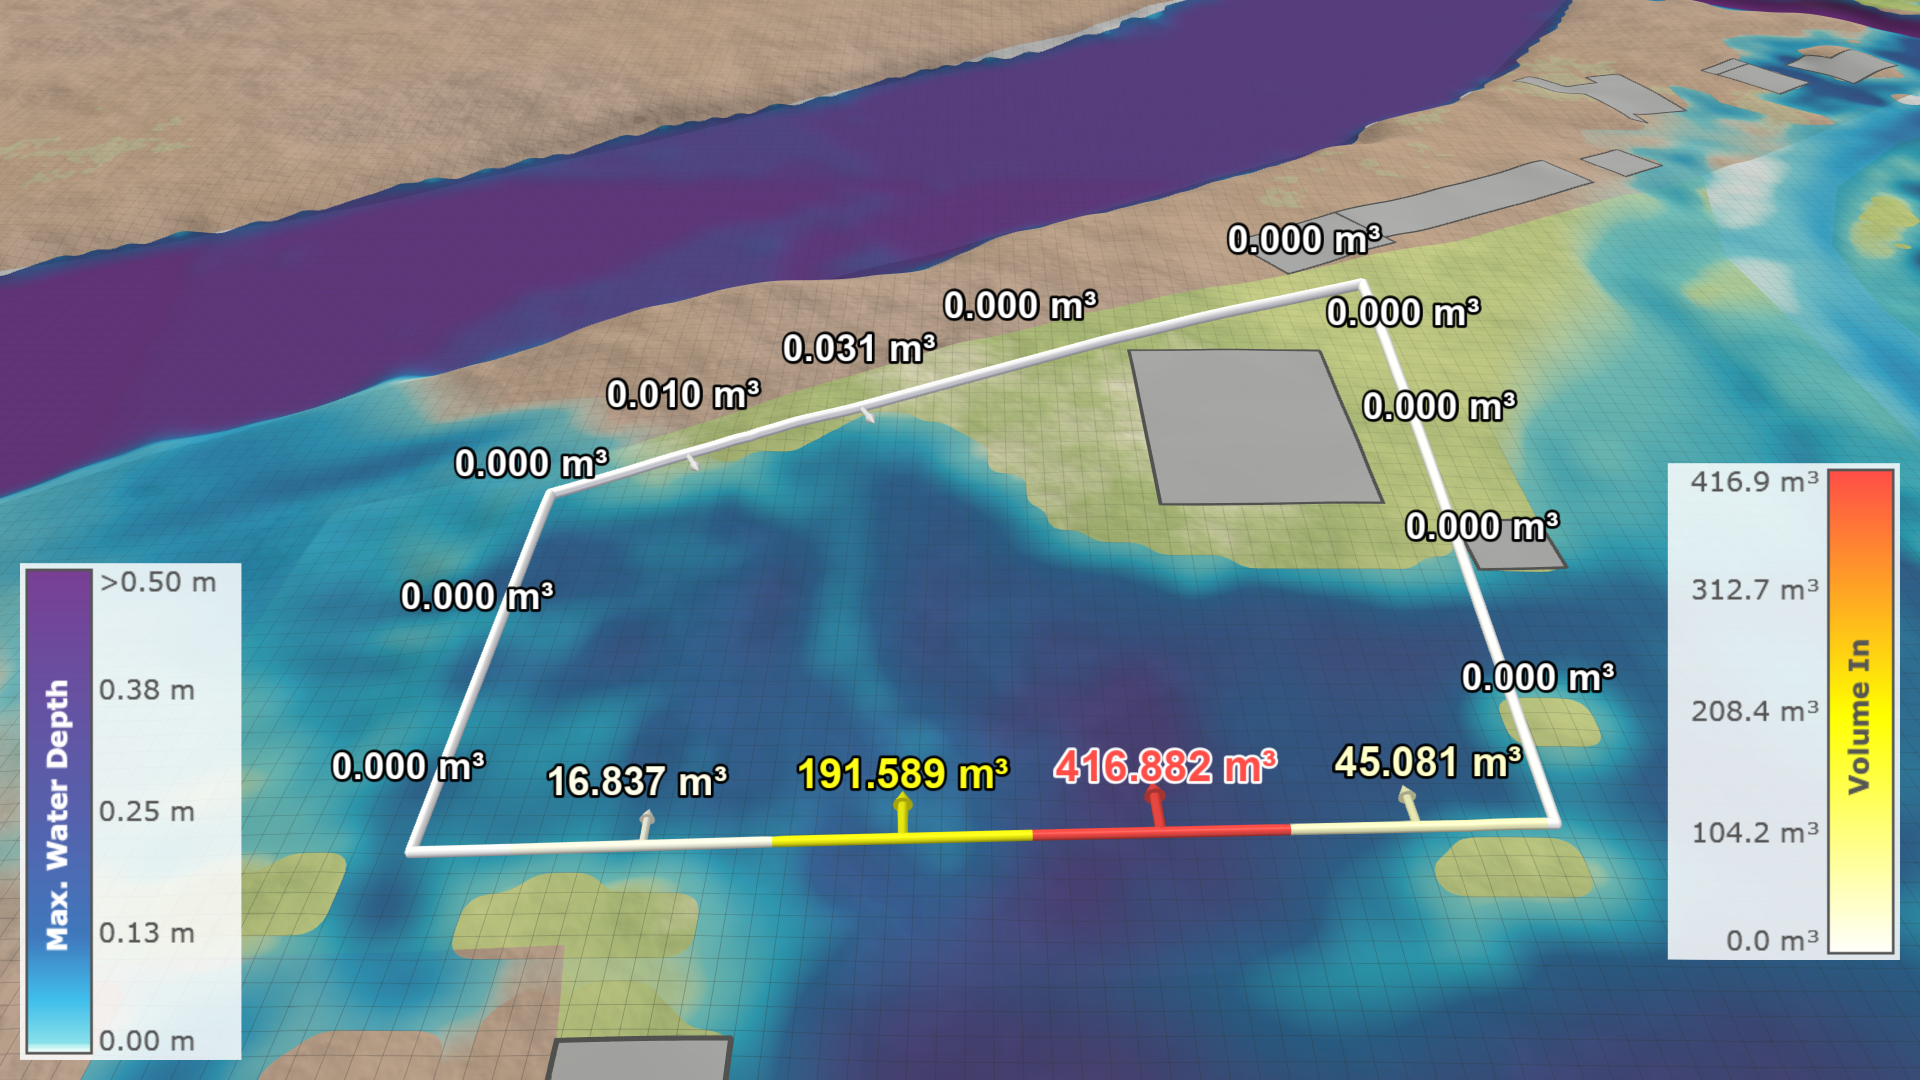 Subdivision length: 10 m
Comparison of Profile Data
A task-based workflow for Comparing and Combining Scenarios is available, explaining how inspections can be compared and combined over multiple scenarios. There are two ways to visualize profile data at selected locations over time, one shows individual plots per action label and the other shows a plot combining all selected profiles:
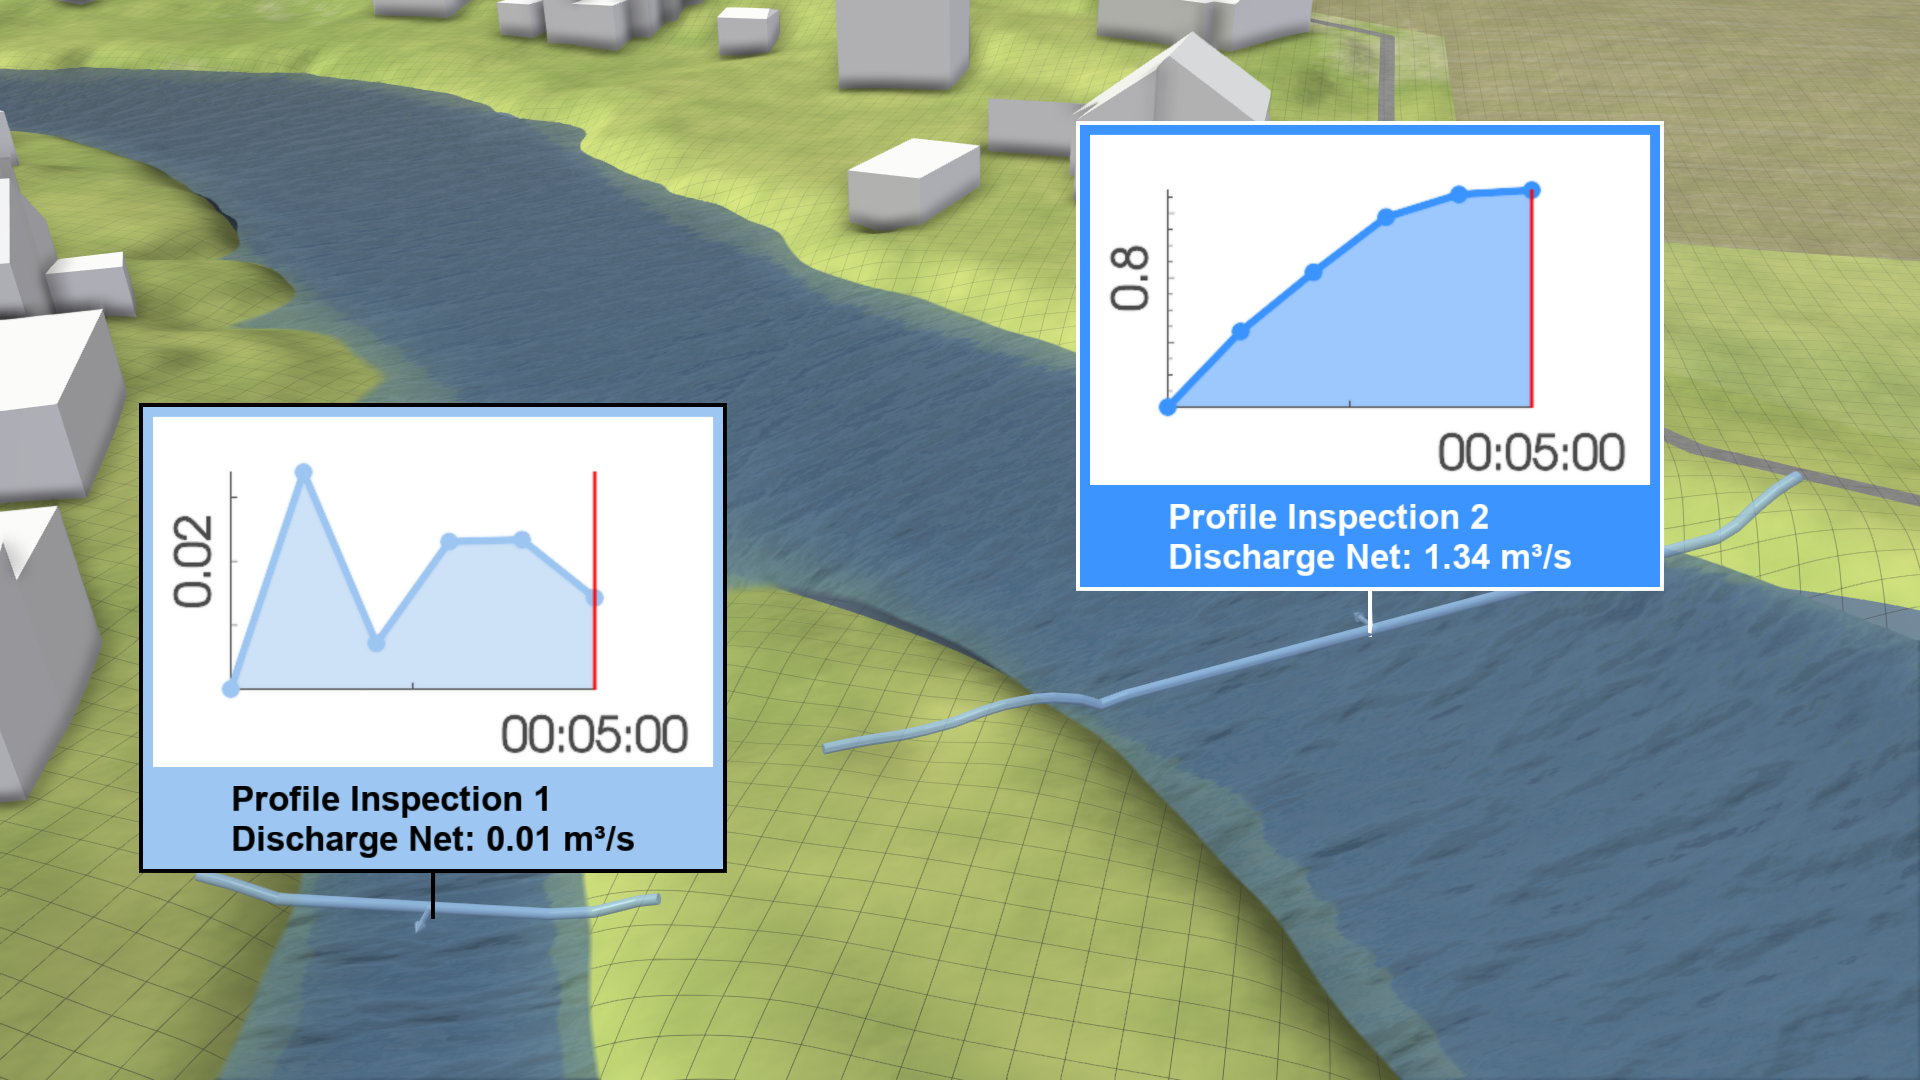
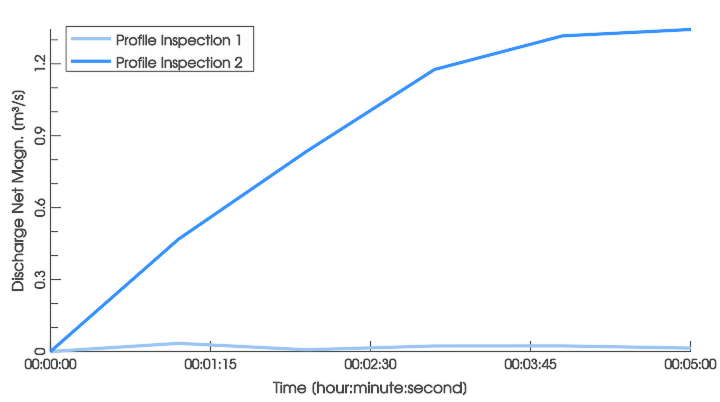
A plot showing all profiles is available in the Plots & Charts Panel under Inspection: Profile. A plot with discharges at the inspections is provided under Inspection: Profile Discharge.
.png)
By default, the label plots show the profile. You can disable the display of plots in the Action Tool Panel or choose a different plot with water discharges or volumes instead.
Hint: The display in the combined plots can be toggled for each inspection in its action settings.
Import Measured Discharges

If measured water levels are available, you can import them using the highlighted setting in the Action Settings Panel. Specify the path to the CSV file containing the water level data as time series. The formatting requirements are explained in Using Your Own Data. The imported data can be compared with simulated data, as described in Comparison and Calibration with Measurements.
Export of Action Data
It is possible to export data from profiles through the Plots & Charts Panel and the Action Tool Panel, as described in Exporting Actions.
| Export interface | Data description |
|---|---|
Plots & Charts Panel > Inspection: Water Depth/Level .png) |
|
Action Tool Panel .png) |
|
Hint: The export of inspected values from the Action Tool Panel only exports values selected for display in the inspection label.